AI reshuffled how products get discovered and purchased. Privacy changes made third-party data unreliable. The explosion of commerce channels made fragmented data dangerous. All three hit at once, and 2026 is the year ecommerce analytics stopped being a reporting function and became an operational one.
The biggest shift: AI agents are now a distinct class of site visitor. They browse catalogs, compare prices, and even complete purchases on behalf of consumers. As a result, analysts get behavioral signals that existing analytics stacks were never built to track. Here are ten ecommerce trends redefining how teams collect, measure, and act on data this year.
Ecommerce analytics trends redefining data infrastructure
Every advanced analytics capability working in 2026 sits on top of the same thing: a solid data foundation. Before you can predict demand, personalize at scale, or measure incrementality, you need data that is collected cleanly, unified across sources, and owned by your team.
Stefan Chiriacescu, Co-founder and CEO of eCommerce Today Agency, puts it plainly:
We have finally stopped treating analytics as a static history lesson of past mistakes, and turned it into a live mechanism that protects profit margins today.
These ecommerce analytics trends are about getting that foundation right. Everything else in this list depends on it.
1. Unified commerce data
The average mid-market ecommerce brand is running a Shopify storefront, paid campaigns across Google, Meta, and TikTok, an email program in Klaviyo, a loyalty platform, and at least one wholesale or marketplace channel on top of that. Each system produces data. Almost none of them connect to each other natively.
The result is what I call the Reconciliation Tax: the hours teams spend every week manually aligning revenue numbers across platforms that should already agree. Your ad platform reports one version of revenue, your ecommerce platform reports another, and your email tool has no idea what happened after the click. By the time the data is ready, the decision window has passed.
Unified commerce data is the effort to eliminate that tax. One destination where every source feeds into the same dataset, so analysis happens on the full picture rather than on isolated platform views.
According to Salesforce, 88% of retailers expect unified commerce to significantly impact their business goals. That number reflects how widely the fragmentation problem is felt, not just in analytics teams but across the business.
Gos Tsotetsi, Founder of FLUF Connect, puts the operational stakes clearly:
The most valuable analytics aren’t about what happened yesterday. They’re about what to do right now: which items to relist, which platform to price higher on based on fee structures, and which categories are trending by sell-through rate.
That kind of real-time, cross-platform decisioning is only possible when the data is already unified. You cannot act on signals you cannot see.
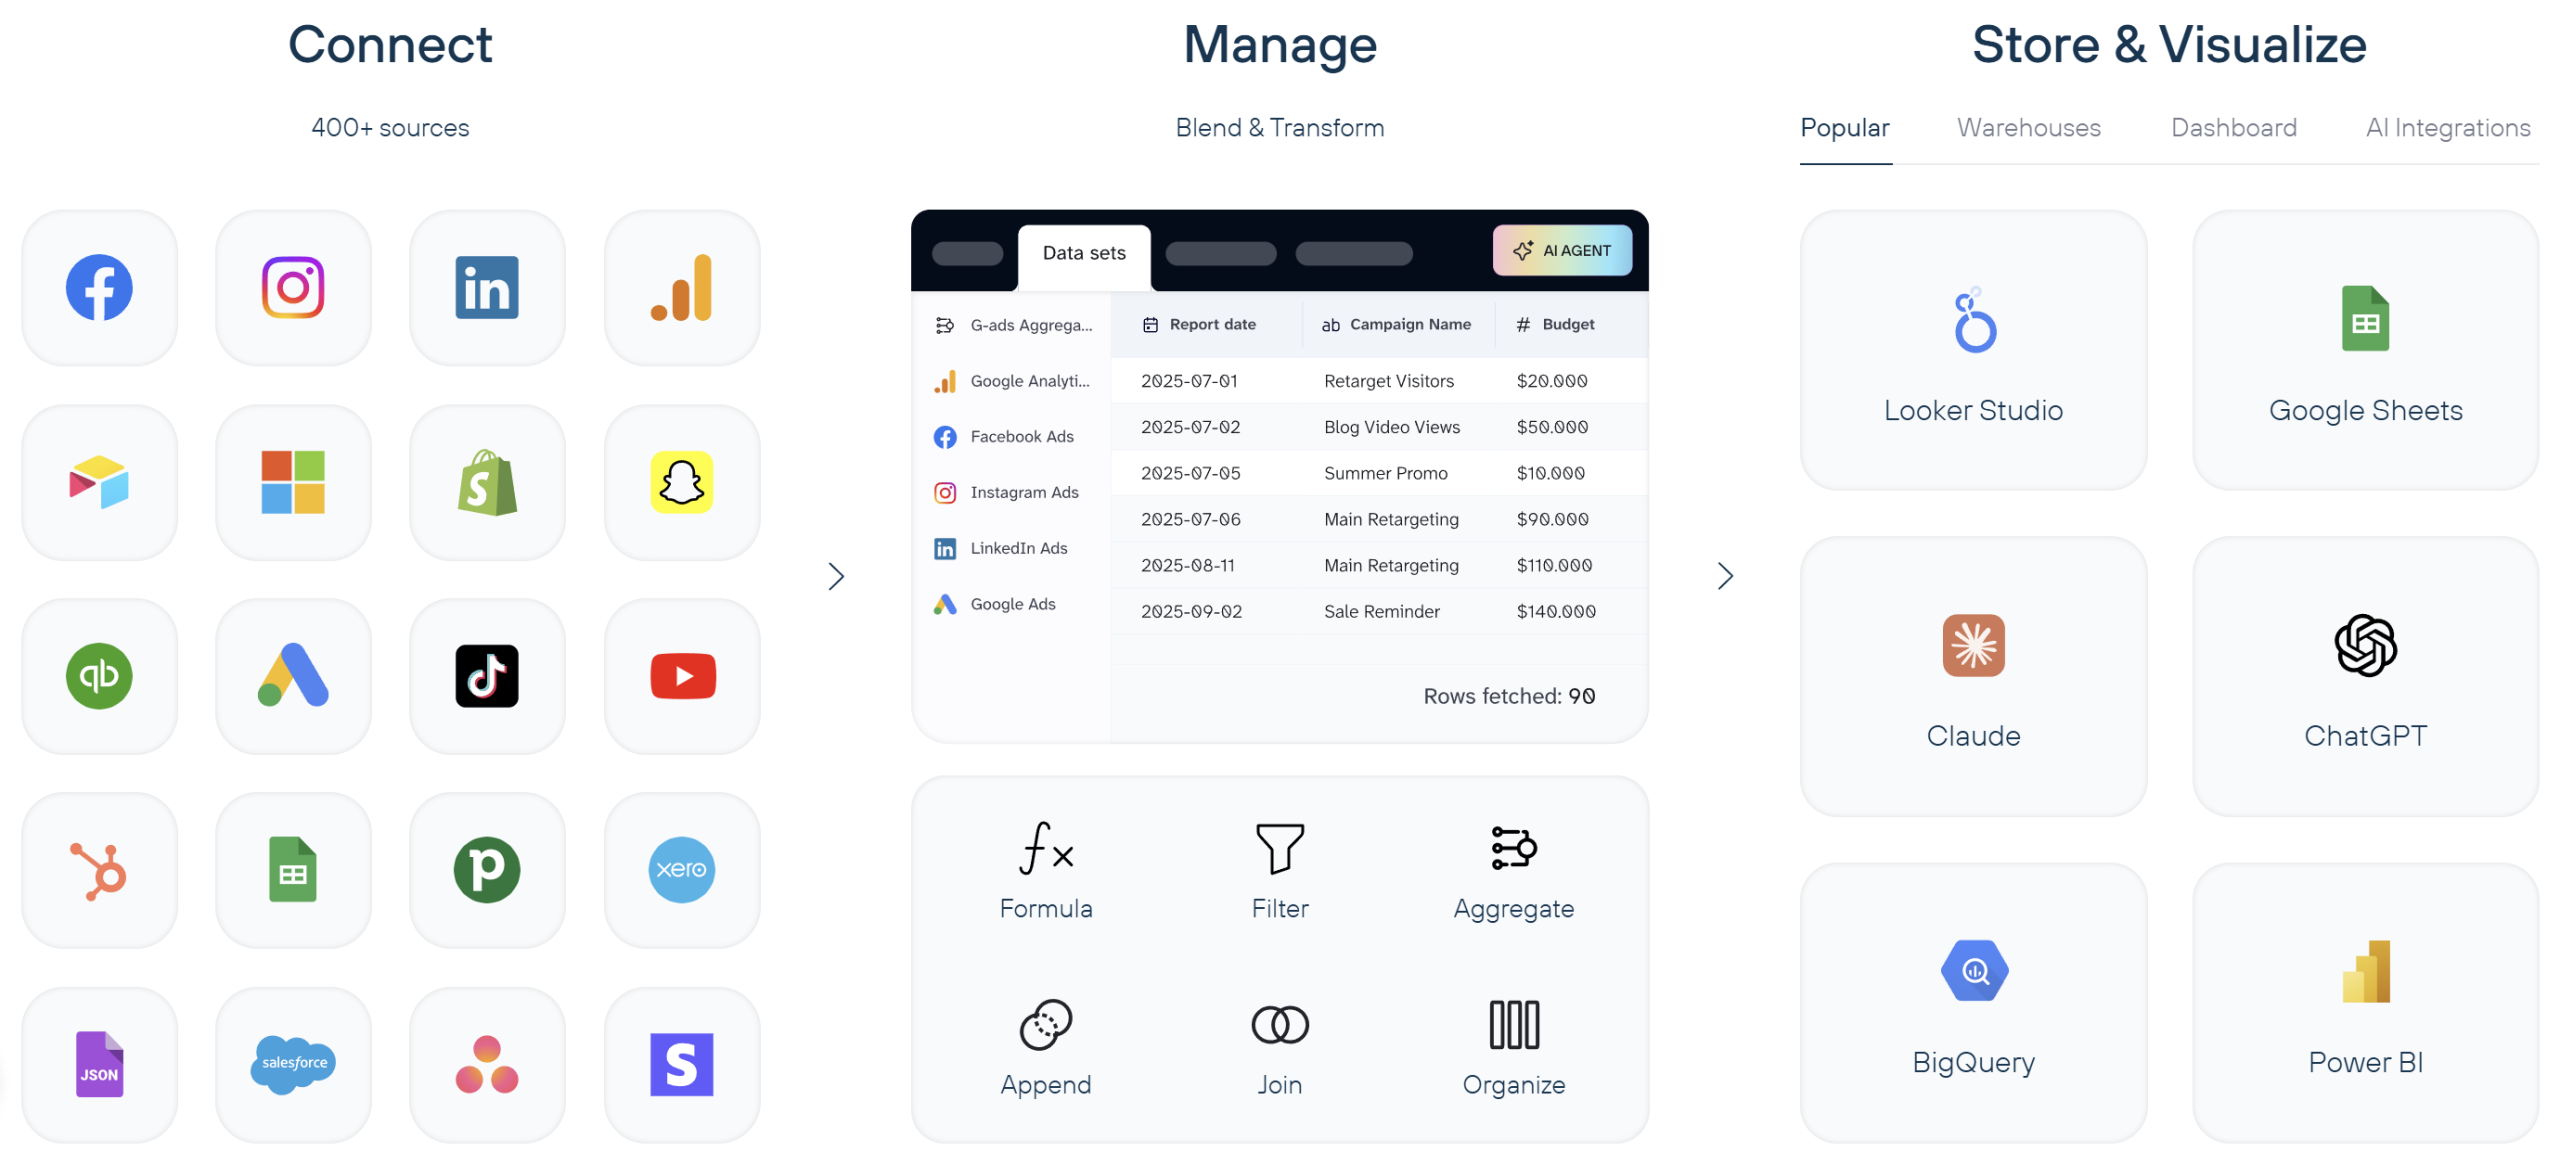
Coupler.io makes the biggest practical difference here. It connects over 400 sources (Shopify, Google Ads, Meta, TikTok, Klaviyo, Amazon, and more) into a single analytics destination automatically. No custom pipelines, no engineering resources. Set up the connections once, define your refresh schedule, and the data flows without manual intervention.
For teams without a dedicated data engineering function, which is most ecommerce businesses outside enterprise, this removes the biggest bottleneck between having data and being able to use it.
Start with your three or four highest-priority sources rather than trying to connect everything at once. Solve the most painful gap first, validate that the unified data gives you cleaner answers, and expand from there.
2. Privacy-first measurement: first-party and zero-party data
Third-party cookies have been on borrowed time for years. Chrome paused its deprecation timeline, but the direction was never in doubt. In 2026, the shift toward privacy-first measurement is well underway regardless of what any single browser does.
The forcing function is the combination of GDPR, CCPA, and a growing set of regional privacy regulations that have made third-party audience targeting unreliable. Add rising user expectations around data transparency, and brands still depending on third-party data face both a compliance risk and a shrinking foundation.
Ken Herron, CMO at Profila, frames the strategic case for this shift:
The highest-value analytics stacks in 2026 will rely less on inferred signals and more on declared, permissioned customer data that improves decision quality before the transaction, not just attribution after it.
The infrastructure response has three parts.
- Server-side tagging moves data collection off the browser and onto your own servers, so measurement no longer breaks when a user has an ad blocker.
- Enhanced conversions take first-party data you already have (email addresses from purchases, sign-ups), hash it for privacy, and recover conversion signals that cookie restrictions would otherwise erase.
- Preference centers give customers a direct way to share what they are interested in and what they consent to. This turns consent from a legal requirement into an actual data source.
Tyler Denk, CEO of beehiiv, a platform built entirely around owned audience data, adds that the real driver is not fear of regulation. It is the clarity that comes from owning your data:
This change isn’t solely driven by concerns around privacy; it’s primarily driven by clarity. When a brand relies on its own data, it has a much clearer view of customer behavior. Rather than attempting to build attribution through multiple platforms, brands have the ability to follow customer behavior through their owned channels.
The performance impact is measurable.
Dave Toby, Managing Director at Pathfinder Marketing, saw it directly with a retail client:
We executed a CRM-connected first-party audience strategy for a retail client; their cost-per-acquisition was 27% lower within 2 quarters than their cost-per-acquisition when they were exclusively using platform-native audiences.
On the infrastructure side, Coupler.io’s direct API-to-warehouse pipelines give ecommerce teams a clean, consent-safe data flow that does not depend on browser-based tracking.
Connect your CRM, ecommerce platform, email tool, and subscription data directly into your analytics destination through server-side API connections. The data arrives complete, consistently formatted, and under your control rather than filtered through whatever privacy restrictions a browser applies.
Analyze your ecommerce data flows with Coupler.io
 Try for free
Analyze your ecommerce data flows with Coupler.io
Try for freeTreat privacy-first as a design principle for your entire analytics stack, not a one-time compliance fix. Audit where your most important metrics still depend on third-party cookies or platform-native audiences. Replace those dependencies with first-party data flows from the systems you already own.
3. Real-time and predictive operational analytics
For most of ecommerce history, analytics operated on a lag. Monthly reports gave way to weekly dashboards. Weekly dashboards gave way to daily check-ins. In 2026, that cadence is compressing further.
But the bigger change is what happens at the end of the pipeline.
Cyrus Kennedy, Chairman and CEO of The Ad Firm, describes it:
Analytics will no longer be sitting in a dashboard waiting for a Monday meeting. Revenue leaders will spend less time reading yesterday’s conversion rate and more time watching live margin signals.
Analytics is moving from surfacing insights for humans to review toward triggering decisions directly: adjusting pricing, reallocating ad spend, flagging inventory issues, reordering catalog ranking. All before a person has opened a dashboard. The report is no longer the output. The action is.
I think of this as the Decision Lag Problem: the gap between when a signal appears in your data and when someone acts on it. Every hour of lag has a cost. An out-of-stock product keeps receiving ad spend. A promotion cannibalizes margin because nobody noticed the discount stacked with a platform coupon. A bid strategy runs on yesterday’s conversion data while today’s traffic pattern has already shifted.
Dave Toby at Pathfinder Marketing has already connected predictive signals directly to campaign execution:
Predictive analytics is pushing away from being a reporting tool to doing something where you have a live campaign running, where it makes decisions, without having to wait for a human to take action. We connected predictive demand signals directly into Google Ads smart bidding for a legal services client and saw an 18% drop in cost-per-conversion when compared to the same period prior.
For most ecommerce teams, the bottleneck is data freshness. A predictive model is only as good as the data flowing into it, and if that data is 24 hours old, the decisions it drives are already behind.
Coupler.io supports high-frequency automated refreshes that keep your BI tools and downstream systems fed with fresh data. Set up scheduled syncs from your ad platforms, ecommerce system, and inventory data at hourly or sub-hourly intervals.
To be clear: this is a scheduled batch refresh, not real-time streaming. For most ecommerce operational decisions, that frequency is enough to close the decision lag that actually costs money.
Automate data refresh for your ecommerce reports with Coupler.io
Get started for freeIdentify the one or two decisions in your business where data lag is costing you. Inventory stockouts caught too late. Ad campaigns that ran over budget because the signal arrived after the damage was done. Shorten the refresh cycle on the inputs to those decisions first.
4. Cross-channel journey analytics
A single purchase might touch a TikTok ad, a Google search, an email, an in-store visit, and a direct website session across multiple days. Most analytics stacks cannot see all of that at once, which means most attribution models work with an incomplete picture.
Cross-channel journey analytics connects ecommerce, retail, social, email, and fulfillment data into a single customer timeline. The goal goes beyond cleaner attribution. It is understanding which combinations of touchpoints build value over time, and which ones only appear to because they happen to be the last step before conversion.
In a case study with Aviator Nation, Shopify found that customers with a retail touchpoint had 23% higher lifetime value than online-only customers. That is a single brand example, not an industry-wide figure, but it shows what becomes visible when online and offline data are connected rather than analyzed in separate ecommerce dashboards.
Xhensila Lala, Marketing Manager at William Morris Wallpaper, found exactly this gap:
The buying path isn’t a funnel anymore. People found us through image search and left. Then came back weeks later through branded queries before they finally purchased. Wrong in the dashboard. Right in the real world. Graph-based models fix that. Instead of placing touchpoints in a straight line, they map out the connections between them.
Assembling this view requires pulling from sources that do not naturally communicate. Your Meta campaigns do not know what your Klaviyo emails drove. Your Shopify orders do not connect to your Google Ads click data. Your in-store POS has no visibility into the digital touchpoints that preceded a purchase.
Coupler.io connects Meta, TikTok, Google Ads, Shopify, Klaviyo, and a wide range of other sources into one destination. Once that data lives in a single place, you can build customer-level timelines that linear attribution misses. Which channels appear early in journeys that convert. Which touchpoint combinations correlate with higher lifetime value. Where customers drop out.
Start with the channels you currently cannot connect. If you can see your paid media data but not your email engagement alongside it, that is the first gap to close. Build incrementally and let the data tell you where the gaps in your current model are most expensive.
Use one connector for all your business data sources
Get started for freeEcommerce industry trends transforming measurement and attribution
Getting the data foundation right is only half the problem. The harder question is what to do with it once it exists. These ecommerce industry trends are about the measurement layer: how ecommerce teams are rethinking what they track, how they attribute value, and which KPIs actually matter in a commerce environment that is fundamentally more complex than it was two years ago.
The complicating factor running through this section is the same one I flagged in the intro. Both humans and AI agents now generate behavioral data. Most measurement systems were built to handle only one of them.
5. Agentic commerce analytics
Something caught me off guard when I first saw it in the data. AI agents, systems that browse, compare, and in some cases purchase autonomously on behalf of consumers, are becoming a real share of site visitors. They are not bots in the traditional sense. Not scrapers or crawlers. They are purposeful visitors with purchasing intent, but they behave nothing like humans.
The scale of this shift is already visible in the data. Adobe Analytics reported a 693.4% increase in retail traffic from generative AI tools during the 2025 holiday season. Salesforce’s 2025 Holiday Shopping Report put the revenue influence of AI and agents at $262 billion in holiday sales alone. These are not projections. They are measurements of what already happened.
Irwin Hau, Founder and Director of Chromatix Web Design, puts the competitive implication plainly:
Your next highest-converting customer might not be a human. It will be an AI acting faster than any user ever could.
Most teams still underestimate the measurement problem here. AI agents generate product views, price comparisons, cart interactions, and session depth. Those signals look like human behavior in your analytics platform. They are not. If you are not segmenting agent traffic from human traffic, your conversion rates, bounce rates, and behavioral benchmarks are all distorted. You are reading signals from a visitor type your models were never trained to interpret.
I call this the Two-Audience Problem. Your analytics stack was built for one type of visitor, and now it needs to serve two with completely different behavioral patterns, intent signals, and value calculations. A spike in product page views might mean rising human interest. Or it might mean three AI agents compared your catalog to a competitor’s overnight. Without segmentation, you cannot tell.
Saurabh Pitkar, Director of Product Management for Agentic Commerce at Dell Technologies, frames the strategic challenge precisely:
Analytics must solve the ‘loyalty gap’ inherent in chat-based invisible storefront interfaces by prioritizing high-fidelity intent mapping and tracking effectiveness to ensure brands remain relevant in an agent-to-agent transaction model.
This points to a new KPI layer that most ecommerce stacks do not have yet. Teams need to track agent traffic share as a percentage of total sessions, API accessibility scores, structured data health across the catalog, and AI-influenced revenue separately from purely human transactions.
Coupler.io has introduced AI integrations that connects ecommerce data to AI tools and agents in a structured, accessible format. Having your data accessible for I agents becomes part of how you remain visible to non-human buyers. This is early infrastructure for a two-audience world, not a complete solution. However, the step toward making your data readable by the visitors grows fastest.
Treat agentic traffic as a first-class measurement category now, even if your tooling cannot fully segment it yet. Audit your traffic for patterns that do not match human behavior. Sessions with no mouse movement. Product views with no scroll depth. High-frequency catalog access from the same IP ranges. Build the habit of asking whether a signal is human or agent before acting on it.
6. Incrementality, MMM, and commerce media measurement
Last-click attribution has been losing credibility for years. In 2026, it has lost the argument. The question is no longer whether to move beyond last-click but how to build the blended measurement system that replaces it.
Two pressures drive the shift. Privacy changes have made individual-level tracking less reliable. And the explosion of commerce channels has made the journey too complex for any single-touch model. A customer who saw a TikTok video, clicked a Google Shopping ad, opened an email, and then purchased directly is not a direct sale. But that is what last-click tells you.
Brandon Batchelor, Head of North American Sales and Strategic Partnerships at ReadyCloud describes where measurement is heading:
Attribution will keep losing ground to decision-quality measurement. More brands will lean into incrementality, media mix modeling, and predictive forecasting because last-click can’t explain what’s actually driving profitable ecommerce growth across fragmented channels.
Incrementality testing flips the question. Instead of asking which touchpoint gets credit for a conversion, it asks what additional revenue a channel actually generated.
Chris Bajda, Managing Partner at Grooms Day, learned this firsthand with a client:
We were working with a large wedding gift website that was spending a significant portion of their budget on retargeting campaigns. The reports looked good, strong return on ad spend across the board. But after running a controlled test and shutting down the campaigns entirely for 30 days, revenue didn’t move. The ads were taking credit for sales that were going to happen anyway. We reallocated the entire retargeting budget toward cold traffic, and within a short period, the client had grown their customer base by over 25%.
That story is not unusual. I have seen variations of it across ecommerce businesses of different sizes. The retargeting campaigns looked profitable by every platform metric. The incrementality test revealed they were measuring correlation, not causation.
Khris Steven, Founder of KhrisDigital, found the same gap on the organic side:
A simple incrementality test showed that 44% of their paid conversions had touched an organic page first. Last-click measures who got the final click and not who actually influenced the buying decision.
Marketing mix modeling adds the macro layer that incrementality tests alone cannot provide. MMM ingests aggregated spend and revenue data across channels over time and models each channel’s contribution to business outcomes. That includes channels hard to track individually: TV, out-of-home, brand awareness.
The IAB has centered its commerce media measurement guidance on incremental measurement, and Google launched Meridian as an open-source MMM to bring the methodology within reach of teams that previously could not afford it.
The prerequisite for any of this is clean, multi-source data in one place. MMM models are only as good as their inputs. If your ad spend data lives in five platform dashboards while your revenue data lives in Shopify, you cannot run a model worth trusting.
Coupler.io solves this by pulling ad spend data from Google, Meta, TikTok, and other platforms alongside revenue and order data from Shopify into a single destination. That unified dataset becomes the input layer for MMM, incrementality analysis, and any other blended measurement approach.
Start with one incrementality test. Pick your highest-spend retargeting campaign and design a holdout test that measures what disappears from revenue when that channel goes dark. The result will either validate your current spend or free up budget going to channels that take credit rather than drive growth.
7. Generative engine optimization (GEO) analytics
Product discovery is changing in a way that most ecommerce analytics stacks cannot see. A growing share of purchase journeys now begins not with a Google search or a social feed but with a question asked to an AI assistant. ChatGPT, Perplexity, Gemini, and Google’s AI Overviews generate product recommendations at scale, and the brands that appear in those answers capture intent that never touches a traditional search results page.
This trend breaks a core assumption most ecommerce teams have operated on for years: that you can measure discovery by measuring traffic. If an AI assistant recommends your competitor instead of you, there is no click to track, no session to analyze, no bounce rate to optimize. The customer never arrived at your site because the decision happened upstream, inside a conversation you had no visibility into.
Ben Lund, Founder of Rise Marketing Group, describes what the measurement shift looks like in practice:
Instead of optimizing for clicks and sessions, brands will need to measure how their products are discovered, evaluated, and recommended within AI conversations, because that’s where decisions are increasingly happening. This shifts ecommerce analytics toward agent visibility and AI-attributed revenue.
The KPIs here are different from anything in a standard ecommerce analytics stack. Brand sentiment share measures how often your brand appears in AI-generated answers relative to competitors. Intent-match scores reflect how well your content aligns with the way AI systems interpret purchasing intent. AI-referred sessions, already trackable through UTM parameters for some platforms, give you a baseline for how much traffic arrives from AI discovery.
The measurement shift also changes how teams think about content. If AI systems choose which brands to recommend based on how clear and structured your product data is, then content quality becomes a discovery lever.
Brandon Hartman, Founder of BeyWarehouse, has already adjusted his operational approach:
Customers are not scrolling through marketplaces anymore but are using AI and chat searches to get exactly what they need. This prompted me to make my product listings as clear and easy to understand so these tools could surface my brand and I remain top of mind.
GEO analytics requires pulling AI referral traffic data alongside search, social, and direct traffic into one view so you can compare how AI-referred sessions perform against other sources. If AI referrals convert at a different rate, or tend toward different product categories, that tells you where your AI-visible content works and where it has gaps. Coupler.io gives you the integration layer to assemble that cross-channel traffic picture without building separate pipelines for each source.
Build a GEO measurement baseline now. Identify your top 20 to 30 product-level queries and test how your brand appears when those questions are asked in ChatGPT, Perplexity, and Gemini. Track whether your brand is mentioned, whether a competitor appears instead, and which content assets the AI draws from. Set up UTM tracking for AI referral sources. You do not need a sophisticated stack. You need a baseline that tells you whether your AI visibility is growing or shrinking.
Ecommerce analytics trends driving profitability and AI-powered growth
The first two sections covered the foundation and the measurement layer. This section is about the output layer, where analytics is not about ecommerce reporting but producing outcomes. These ecommerce trends are where trends 1 through 7 translate into business decisions. And where AI becomes embedded in daily operations rather than discussed in meetings.
8. Profitability, returns, and post-purchase analytics
For most of ecommerce’s growth era, the dashboard that mattered was the revenue dashboard. Gross revenue, conversion rate, average order value. Those numbers made sense when growth was the primary goal and margins were something finance worried about separately.
That era is over. The ecommerce teams pulling ahead in 2026 have replaced revenue dashboards with profitability dashboards. They track contribution margin per order, CAC-to-margin efficiency, return rates by product and channel, and the actual cost of fulfillment against the revenue it generates. Revenue tells you what came in. Profitability tells you what you kept.
Returns are where this shift becomes most urgent. McKinsey’s report puts the scale of the problem in stark terms: US consumers returned nearly $1 trillion in merchandise in 2024, costing retailers around $200 billion annually. That is not a rounding error. It is a structural drain on margin that most ecommerce analytics stacks are not built to surface clearly.
The broader shift is toward contribution margin as the primary metric. Contribution margin strips out variable costs (ad spend, fulfillment, returns, discounts) to show what each order actually contributes. CAC-to-margin efficiency asks whether the margin a customer generates over time justifies the cost of acquiring them.
These metrics exist in most businesses already, but they live in separate systems. Ad costs in platform dashboards. Fulfillment costs in the 3PL or ERP. Return costs somewhere else entirely. Revenue in Shopify. No single view connects them.
Coupler.io solves this with its Shopify connector that collects Shopify order data, ad platform spend, 3PL and ERP fulfillment and returns data into a single destination. Teams get margin visibility at the order level. It’s not limited to Shopify, by the way. You can use a WooCommerce connector or any other business tool you work with, from over 400 available options.
I have watched teams go quiet when they see this data for the first time. The product category they thought was their best performer turns out to be margin-negative once returns, fulfillment costs, and acquisition spend are factored in.
Make contribution margin the primary KPI your analytics stack is built around. Map every variable cost that touches an order: ad spend, fulfillment cost, return rate and processing cost, discounts applied. Connect those sources into one place and build a margin view at the product and channel level. You will almost certainly find that your most profitable products are not the ones your current dashboards highlight.
9. AI copilots and natural language analytics
There is a friction point in analytics that most teams have accepted as normal. Getting answers requires either building a dashboard in advance or waiting for an analyst to pull the data. If a question was not anticipated when the dashboard was designed, it goes into a queue. By the time the answer arrives, the decision has already been made on instinct.
Natural language analytics removes that friction. Team members ask questions in plain language and get answers immediately. “Which products had the highest return rate last month?” Answered in seconds without technical skill.
Shopify has built AI-assisted analytics directly into its merchant dashboard. Adobe has tied its AI analytics features to predictive insights and real-time personalization across its commerce suite. The category has gone mainstream.
But here is what makes this interesting for ecommerce: the questions that drive the best decisions are almost always cross-platform questions. “How did our Meta spend last week affect Shopify revenue?” “Which Klaviyo campaigns drove the highest-margin orders?” No single-platform AI assistant can answer those.
Harry Chu, Founder and CEO of TrueProfit,has seen this play out:
We launched an MCP connection which allows merchants to track and analyze profit data in real-time using large language models, transforming raw analytics into immediate, actionable business intelligence rather than static reporting.
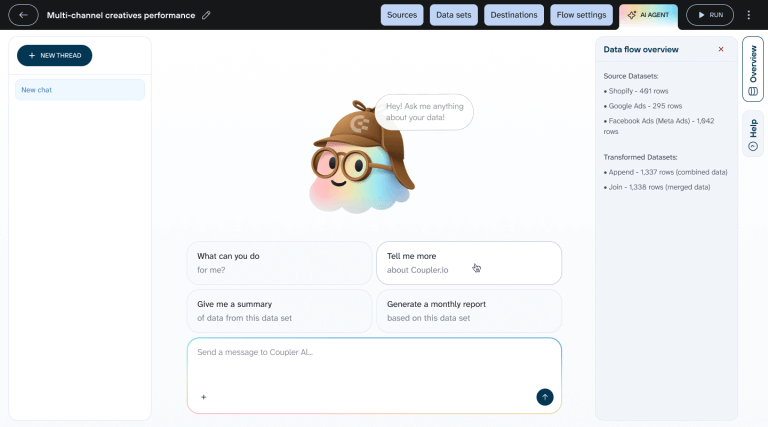
Coupler.io’s AI Agent feature brings this capability to the data integration layer. Most natural language analytics tools work within a single platform: you ask Shopify about Shopify data, or Adobe about Adobe data. Coupler.io’s AI Agent works across the unified dataset from 400+ sources, so cross-platform questions become answerable without building a custom dashboard or writing a query.
Identify the five questions your team asks most often that currently require analyst time or custom dashboard work. Those are your starting point. Connect your core data sources, point your AI analytics layer at the unified destination, and measure how much time gets reclaimed when those questions become self-service.
Talk to your data using Coupler.io AI Agent
Get started for free10. Hyper-personalization at the individual level
Personalization in ecommerce has stayed at the segment level for years. Show women aged 25 to 34 this banner. Show returning customers this offer. Show mobile visitors this layout. Segments help, but they are a blunt instrument. A segment of a million customers still contains wide variation in intent and readiness to buy.
The shift accelerating in 2026 moves from segment-level to individual-level personalization: systems that model each visitor’s intent in the current session and adapt the experience in real time. Per-session propensity modeling evaluates what a visitor is likely to do next based on current behavior combined with purchase history.
Real-time catalog re-ranking reorders the product grid for each visitor, so two people searching the same term see different results ranked by what each is most likely to buy.
The commerce context for this shift is significant. Social commerce in the US is expected to surpass $100 billion in 2026 according to eMarketer. That volume flows through channels where the experience is already personalized at the feed level. Customers arriving from TikTok or Instagram have been algorithmically matched to content tailored to their behavior. Landing on a generic storefront after that experience feels like a step backwards, and the conversion data reflects it.
Angelo Coletta, CEO and Co-Founder of Zakeke, points to a source of personalization signal that most teams are not yet using:
Interactions within configurators and interactive environments generate far richer insights than clickstream data, enabling brands to understand preferences, hesitation patterns, and purchase intent with much greater precision.
That observation extends beyond configurators. Any high-intent interaction (time spent comparing product variants, repeated returns to the same page, partial configuration starts) contains more signal about individual intent than a page view or a click. The brands building individual-level personalization are learning to read those signals and act on them within the same session.
Khris Steven, Founder of KhrisDigital, has already connected this kind of intent signal to automated action:
One of my clients had increased conversion by 34% in their email trigger sequences by connecting purchase intent signals to their email trigger logic versus waiting 24-hour flat runs.
That result comes from the same underlying principle: acting on individual intent signals in near real time rather than waiting for a segment-level rule to trigger on a fixed schedule.
Same principle: acting on individual intent signals in near real time rather than waiting for a segment-level rule to trigger on a fixed schedule.
Personalization engines need a continuous feed of behavioral data, purchase history, product catalog attributes, and session signals. If that data lives in fragmented systems, the personalization layer works with an incomplete picture. Coupler.io combines behavioral, transactional, and catalog data from across your commerce stack into one unified destination. That gives personalization engines the complete signal they need to model at the individual level.
Start with one high-intent moment. Post-add-to-cart is often the highest-leverage point. A visitor who has added something to their cart has revealed clear intent, and what happens in the next few minutes matters more than most teams realize. Build your first individual-level personalization test around that moment, measure the impact, and expand from there.
What these trends have in common
Looking across all ten ecommerce analytics trends, the through line is the same one I opened with: analytics has stopped explaining the past and started shaping what happens next.
Brandon Batchelor, Head of North American Sales and Strategic Partnerships at ReadyCloud, puts the competitive stakes clearly:
The real winners will be the companies that connect first-party data, AI-driven forecasting, and operational execution fast enough to act before the opportunity disappears.
“Fast enough” is doing a lot of work there. The gap between seeing a signal and acting on it is where budget bleeds out, where inventory goes wrong, and where customers close to converting end up somewhere else.
If you are looking at these ten trends and wondering where to start, ask yourself one question. What is the most expensive data gap in my business right now? Maybe it is the reconciliation tax from fragmented sources (trend 1). Maybe it is retargeting spend that has never been tested for incrementality (trend 6). Maybe it is agent traffic inflating your behavioral benchmarks without anyone noticing (trend 5).
Find that gap. Fix it. Measure the impact. Move to the next one. The teams making the most progress in 2026 are not the ones that overhauled their entire stack in a quarter. They are the ones that got specific about what was broken, fixed it, and compounded from there.
