How to Connect Google Ads to Google Data Studio (Looker Studio)

Visualizing Google Ads metrics in Google Data Studio (formerly Looker Studio) can help you better understand the main correlations, identify opportunities for improvements, optimize your ad budget, and more. If you also connect other ad apps to Looker Studio, you can create insightful cross-channel reports and live dashboards that will give you a detailed overview of all your campaigns. This is a convenient way to track performance, analyze metrics across different channels, and share main insights with clients and colleagues without giving them access to the data source accounts.
In this article, we provide you with step-by-step instructions for connecting Google Ads to Looker Studio with different methods.
Linking Google Ads to Google Data Studio (Looker Studio) – what are the options?
There are a couple of ways to connect Google Ads to Looker Studio. The first and most obvious method is to use the native Google Ads connector. It’s simple, reliable, and hassle-free. However, it has limited scheduling options, and, in general, the functionality is very basic – it just connects the two apps and transfers data. In many cases, this could be enough.
But if you want to analyze Google Ads campaign performance along with other ad platforms or marketing apps in Looker Studio, you need a partner connector by Coupler.io. It lets you blend data from multiple sources and transform your data before loading it to Looker Studio. In this case, you can receive much broader functionality and make working with your ad data significantly easier and more efficient.
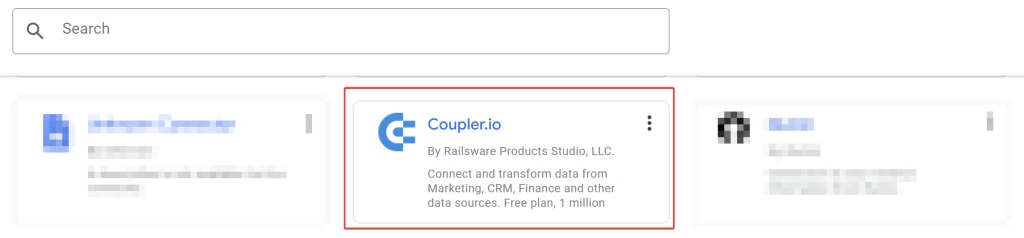
Using a partner solution to connect Google Ads to Looker Studio is arguably the best and most efficient method, so we’ll start with this option. And then we will provide step-by-step instructions for the default method in one of the next sections.
How to connect data from Google Ads to Looker Studio with Coupler.io
Opting for external solutions to link the two apps is a great way to benefit from the expanded set of features and get more flexibility. This can also help you work with your data in a simpler and more efficient way.
How to set up an automated integration to link Google Ads to Looker Studio
Coupler.io allows you to connect Google Ads to Looker Studio with direct integration. Here’s how to do this:
Step 1. Collect data
We’ve already preselected Google Ads as a data source and Looker Studio as a destination. So, you only need to click Proceed in the form below. You’ll be prompted to create a Coupler.io account for free.
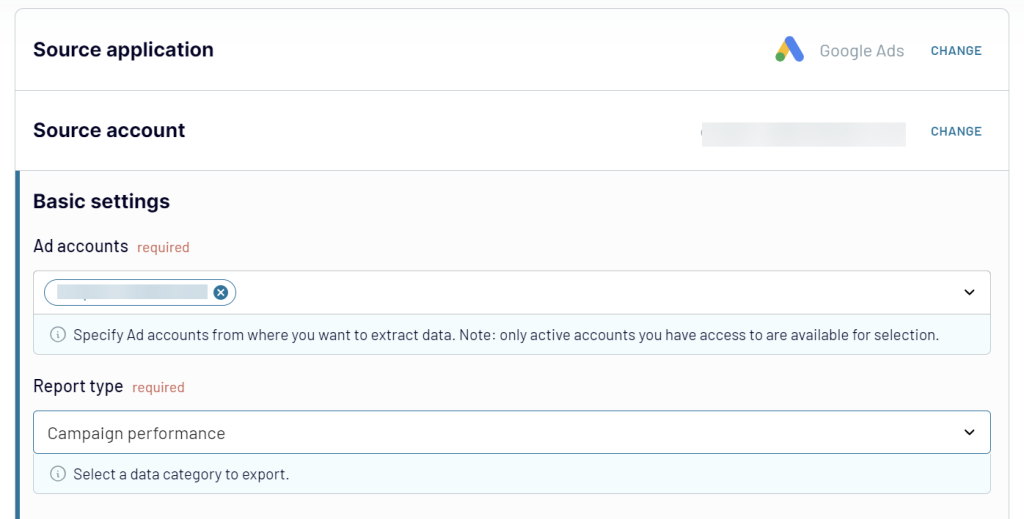
Then connect your Google Ads account and grant the requested permissions. Select the data entity you need to export. You can pull raw data such as Ads, Campaigns, or User List, and reports such as Ad Performance or Campaign Performance.
When everything is ready, you can connect more data sources if you wish to build a cross-channel dashboard. Alternatively, you can add other Google Ads accounts if you have several. Just click the Add one more source button and repeat the same steps that we’ve described above for connecting Google Ads. You can connect as many apps as you need. Once you have connected all your data sources (or just one source), you can switch to the Transform module.
Step 2. Transform data
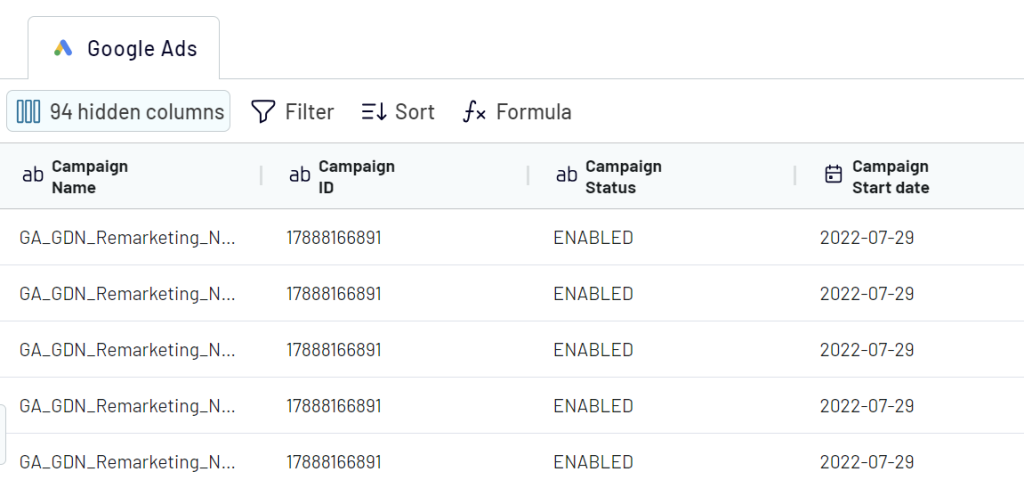
Here’s what it looks like. You can see data fetched from your sources, as well as preview the result of transforming it. Coupler.io allows you to check and manipulate your data before loading it to Looker Studio. In particular, in the Transform module, you can:
- Preview and blend data – see if everything loads correctly before actually exporting the data. If you need to combine datasets from several sources, you can check if your data blends smoothly and make the necessary adjustments.
- Manage columns – hide the columns you don’t want to export, add new columns, rename and reorder them, change their type, and merge information from several columns into one.
- Sort and filter data – use various filters to extract only the data you need based on a set of criteria, as well as sort your data.
- Perform calculations – you can calculate new metrics based on your data directly within Coupler.io’s interface. All you need to do is to add a new column and provide a formula for the calculations.
Step 3: Load & Automate
Now, let’s connect your Looker Studio account. Follow the instructions in the importer to set up the connection. Once everything is ready, click the Create report button to start building your dashboard.
Now you know how to connect data from Google Ads to Looker Studio automatically. In the next section, we explain how you can visualize this data using Google Ads dashboard templates.
With Coupler.io, you can extract data from 400+ business apps and load it automatically on a schedule to Looker Studio, Google Sheets, Excel, BigQuery, and Power BI. Among the available data sources, you can find such apps as Google Ads, Mailchimp, GA4, LinkedIn Ads, YouTube, Pipedrive, Hubspot, Salesforce, and many others. Also, if you need to connect Bing Ads to Looker Studio or Power BI, you won’t have any trouble with this either. You can also use the solution to connect Google Ads to Power BI.
Why use the partner Looker Studio connector by Coupler.io?
- Combining data from multiple sources – if you connect several apps to Looker Studio, it will get slow, and performance will be significantly impacted. But if you use another solution to connect various data sources to Looker Studio, this problem won’t emerge. In addition to this, with a third-party solution, you even can blend your data smoothly into one dataset for cross-channel analysis.
- Data transformation – when you need to calculate custom metrics or perform other manipulations with your data, the situation is similar. Looker Studio gets slow if you add calculated columns on its side. However, if you use a solution with the ETL functionality, you can perform all the calculations, sorting, filtering, and more before transferring your data to Looker Studio. In this case, you will get a well-performing dashboard ready for interactive presentation or analysis.
- Automated templates – you can use a pre-set Google Ads template to create a dashboard literally in minutes. You only need to connect your Google Ads and Looker Studio account – all the data will be extracted and visualized automatically. As a result, you will get an automated self-updating dashboard.
- Streamlining your data flows – in general, using one tool to manage all your data across dozens of apps is a great way to optimize your data flows, boost efficiency, and lay the foundation for data-driven decisions. A comprehensive data integration solution can help you collect, transform, and analyze your data, as well as act on it.
How to build a Google Ads dashboard in Looker Studio with a free template
There are several approaches to building a dashboard: You can do it yourself from scratch, you can use a template, or you can hire data professionals to do it for you. Let’s briefly explore each of these methods.
DIY: Building a dashboard manually
Creating a dashboard from scratch is a good option if you need significant customization and also have experience in working with Looker Studio, or have the desire to gain such experience.
If you need tips on how to visualize your data step by step, check our Looker Studio Tutorial: Dashboard for Beginners article. In that blog post, we’ve already covered the basics you will need to create your first dashboard – preparing the dashboard layout, adding scorecards, building graphs, etc.
Hiring professionals to build data visualization
However, in some cases, you might need to create advanced visualizations that bring together huge datasets from multiple sources. Such pro-level dashboards can be important tools for data analysis, ongoing monitoring, and enabling informed decisions. Building such analytical tools requires data analytics expertise. If your organization doesn’t have such professionals in-house, hiring experts can be a viable option.
Using an automated template
A much faster way is to use a Google Ads Looker Studio template. This is a very efficient option, especially when you don’t have much time on your hands and only need a little to moderate customization.
Coupler.io offers a comprehensive collection of Google Ads dashboard templates, each designed for specific analysis needs. Here are the top 5 templates that will transform your Google Ads data into actionable insights:
1. Google Ads campaign performance dashboard
This comprehensive dashboard provides essential campaign monitoring capabilities with automated data integration through Coupler.io’s Looker Studio connector.
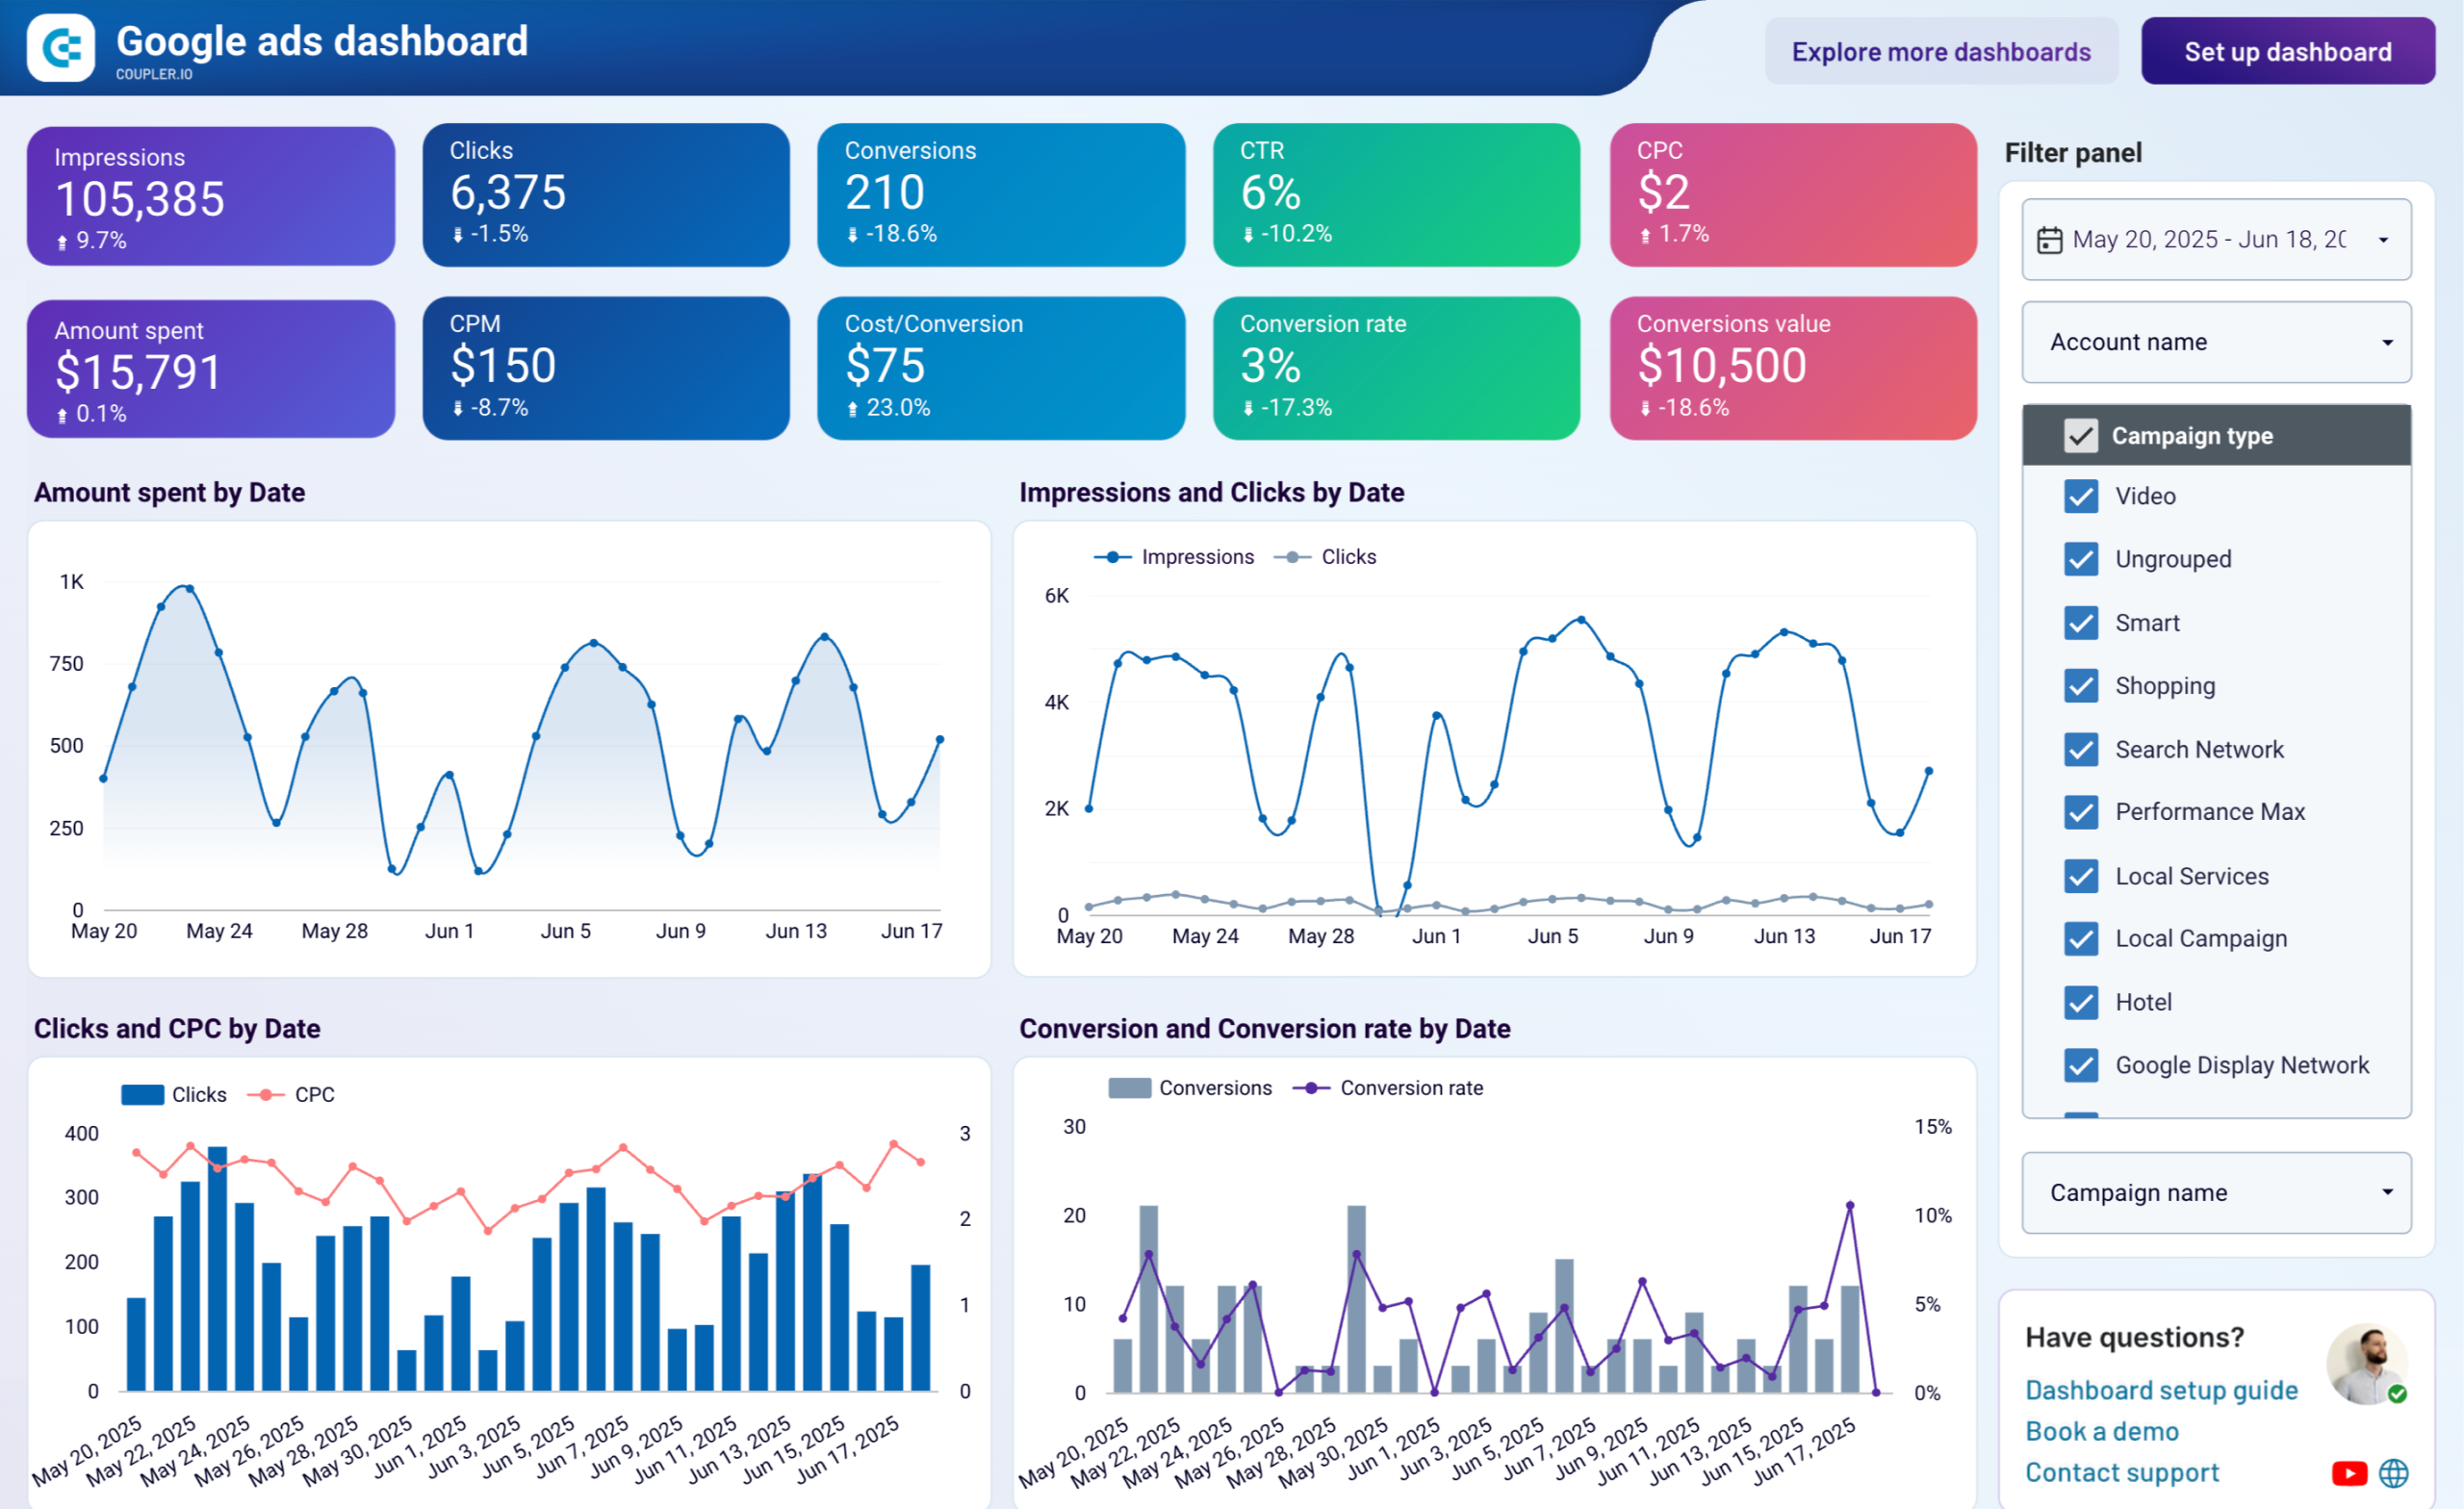
The template displays crucial metrics like impressions, clicks, conversions, and cost data with dynamic period-over-period comparisons. You can easily filter by campaign type and name to drill down into specific segments of your advertising data. The dashboard includes conversion funnel visualization and demographic breakdowns, making it perfect for comprehensive campaign analysis.
The template is fully automated – once you connect your Google Ads account through Coupler.io, your data appears instantly and updates on schedule. This eliminates the need for manual data exports and ensures your reports always reflect current performance.
2. Google Ads monthly performance dashboard
For strategic planning and executive reporting, this monthly performance dashboard reveals long-term trends and seasonal patterns in your advertising data.
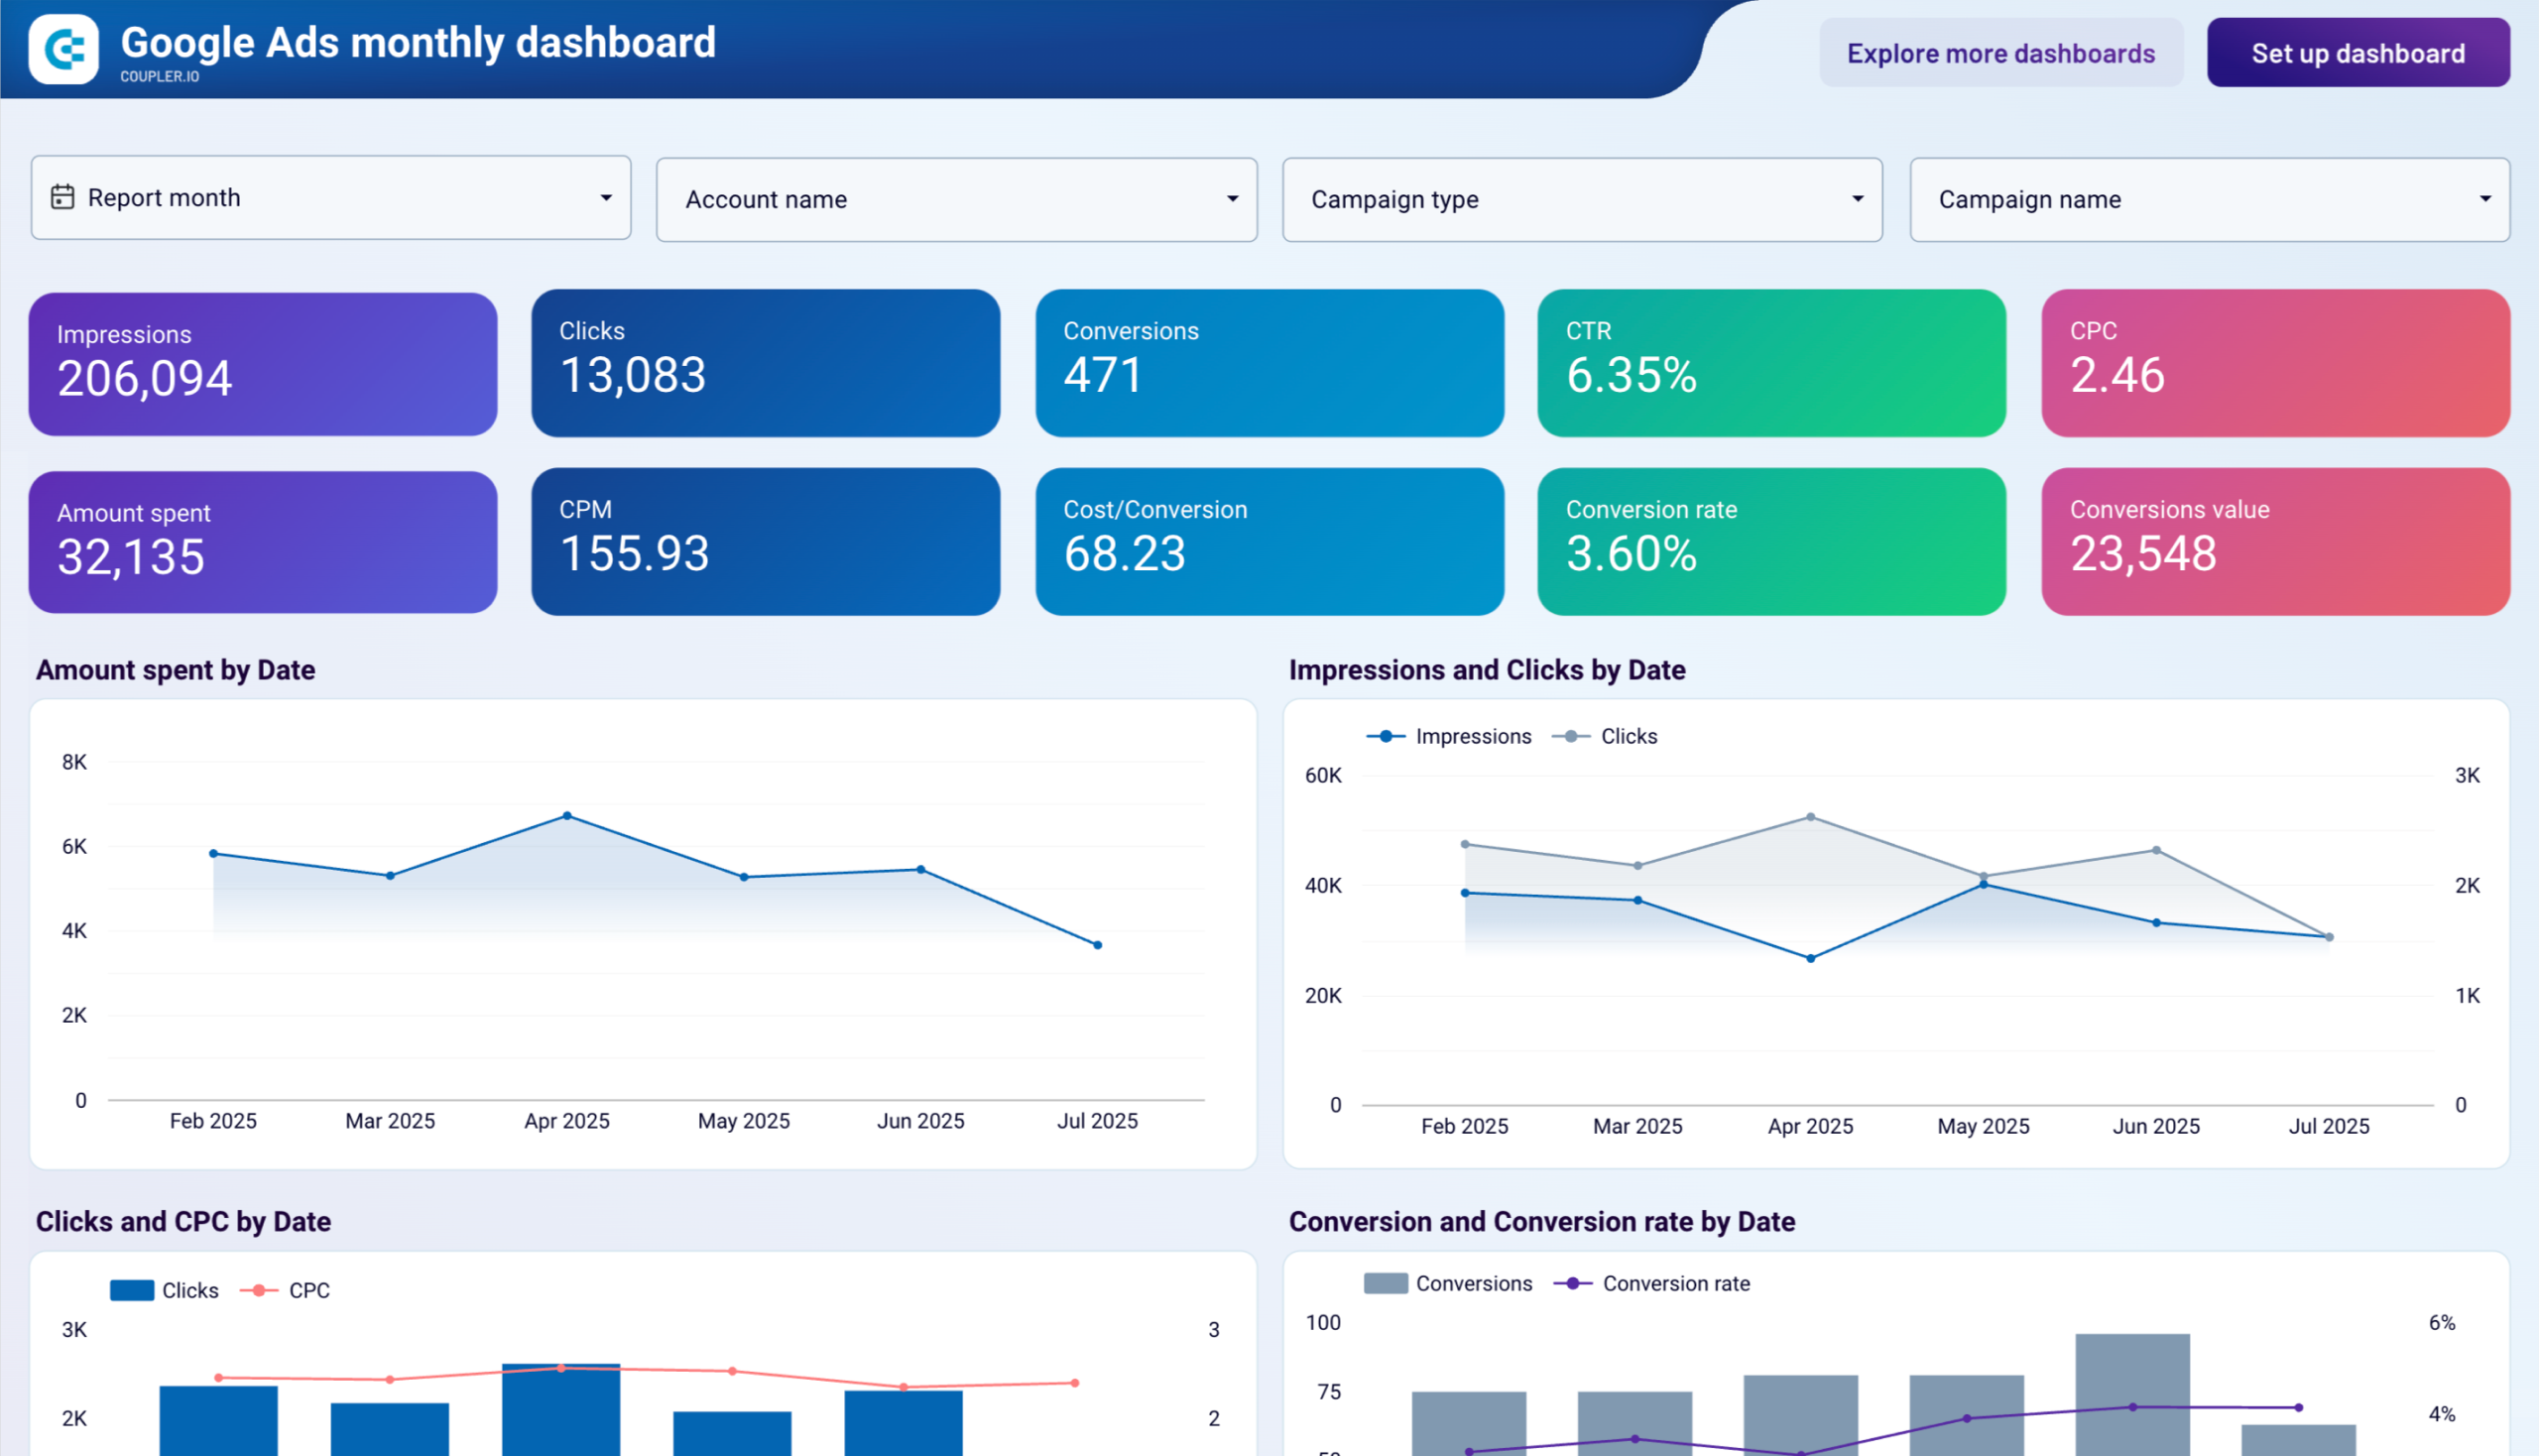
Rather than focusing on daily fluctuations, this template organizes your data into monthly views that highlight growth trajectories and performance cycles. The dashboard features campaign spend allocation analysis, demographic performance over time, and geographic trend mapping. Monthly keyword performance tracking helps identify long-term optimization opportunities.
This dashboard excels at presenting quarterly business reviews and budget planning sessions. The trend visualizations make it easy to spot the best periods for scaling campaigns and adjusting targeting strategies based on historical performance data.
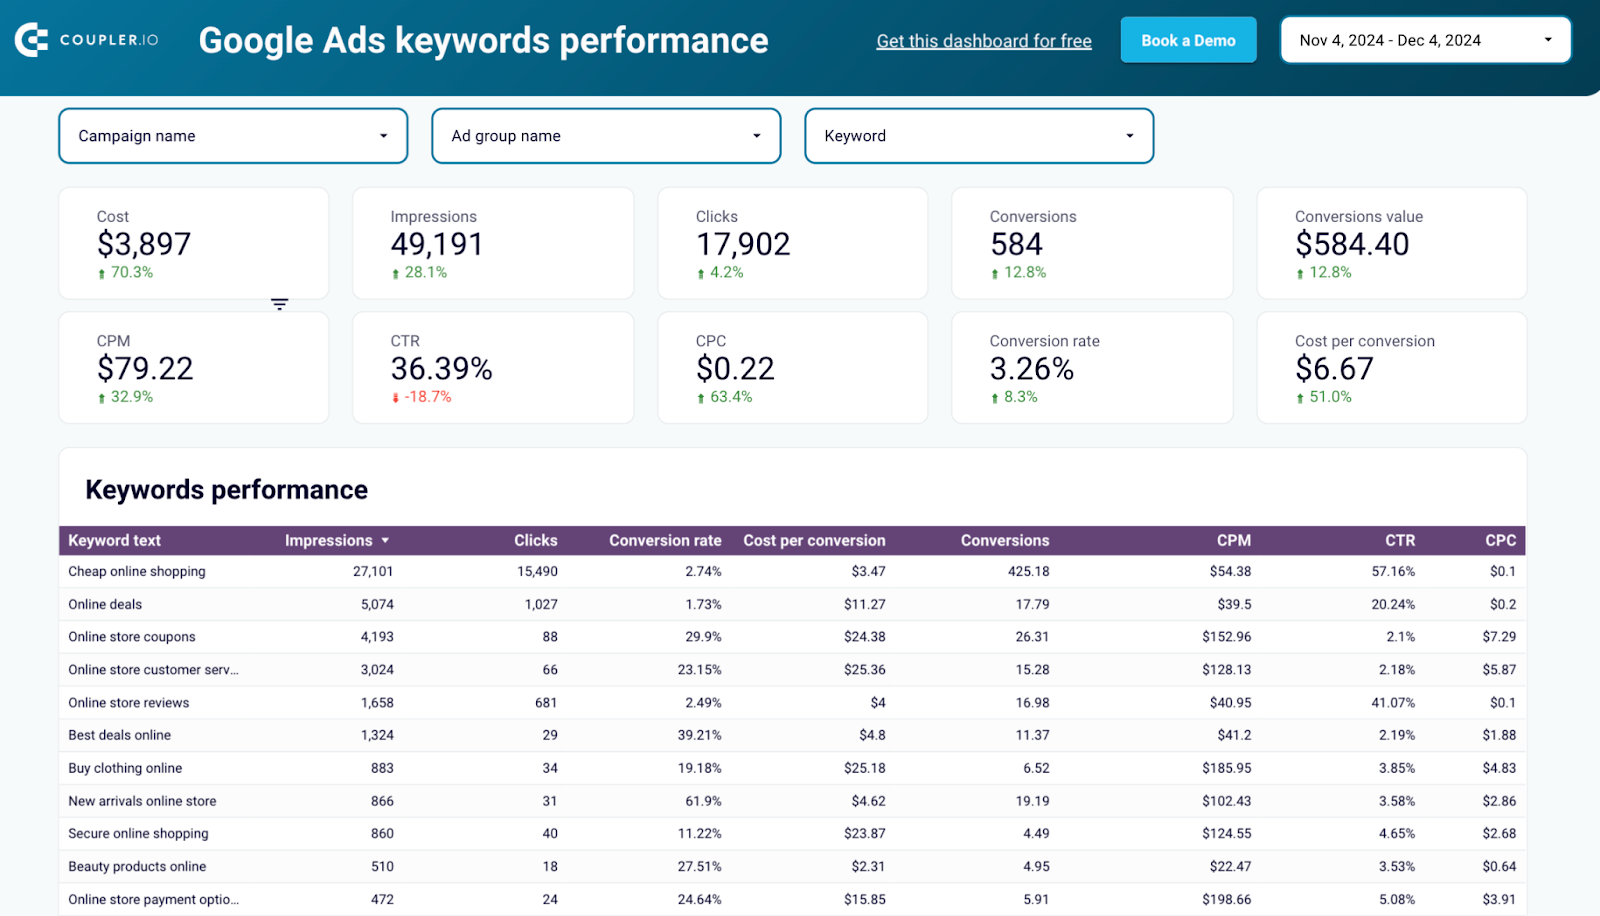
3. Google Ads keyword performance dashboard
Optimize your search advertising strategy with this specialized keyword-level analysis dashboard designed for PPC professionals.
Google Ads keywords performance dashboard
 Preview dashboard
Google Ads keywords performance dashboard
Preview dashboardThe template provides detailed keyword performance metrics including search impression share, quality scores, and conversion tracking by individual keywords. You can identify top-performing keywords, analyze search term reports, and spot optimization opportunities through performance trend analysis.
Key features include keyword grouping analysis, search impression share monitoring, and cost-per-conversion tracking at the keyword level. The dashboard helps you make data-driven decisions about bid adjustments, negative keyword additions, and keyword expansion strategies.
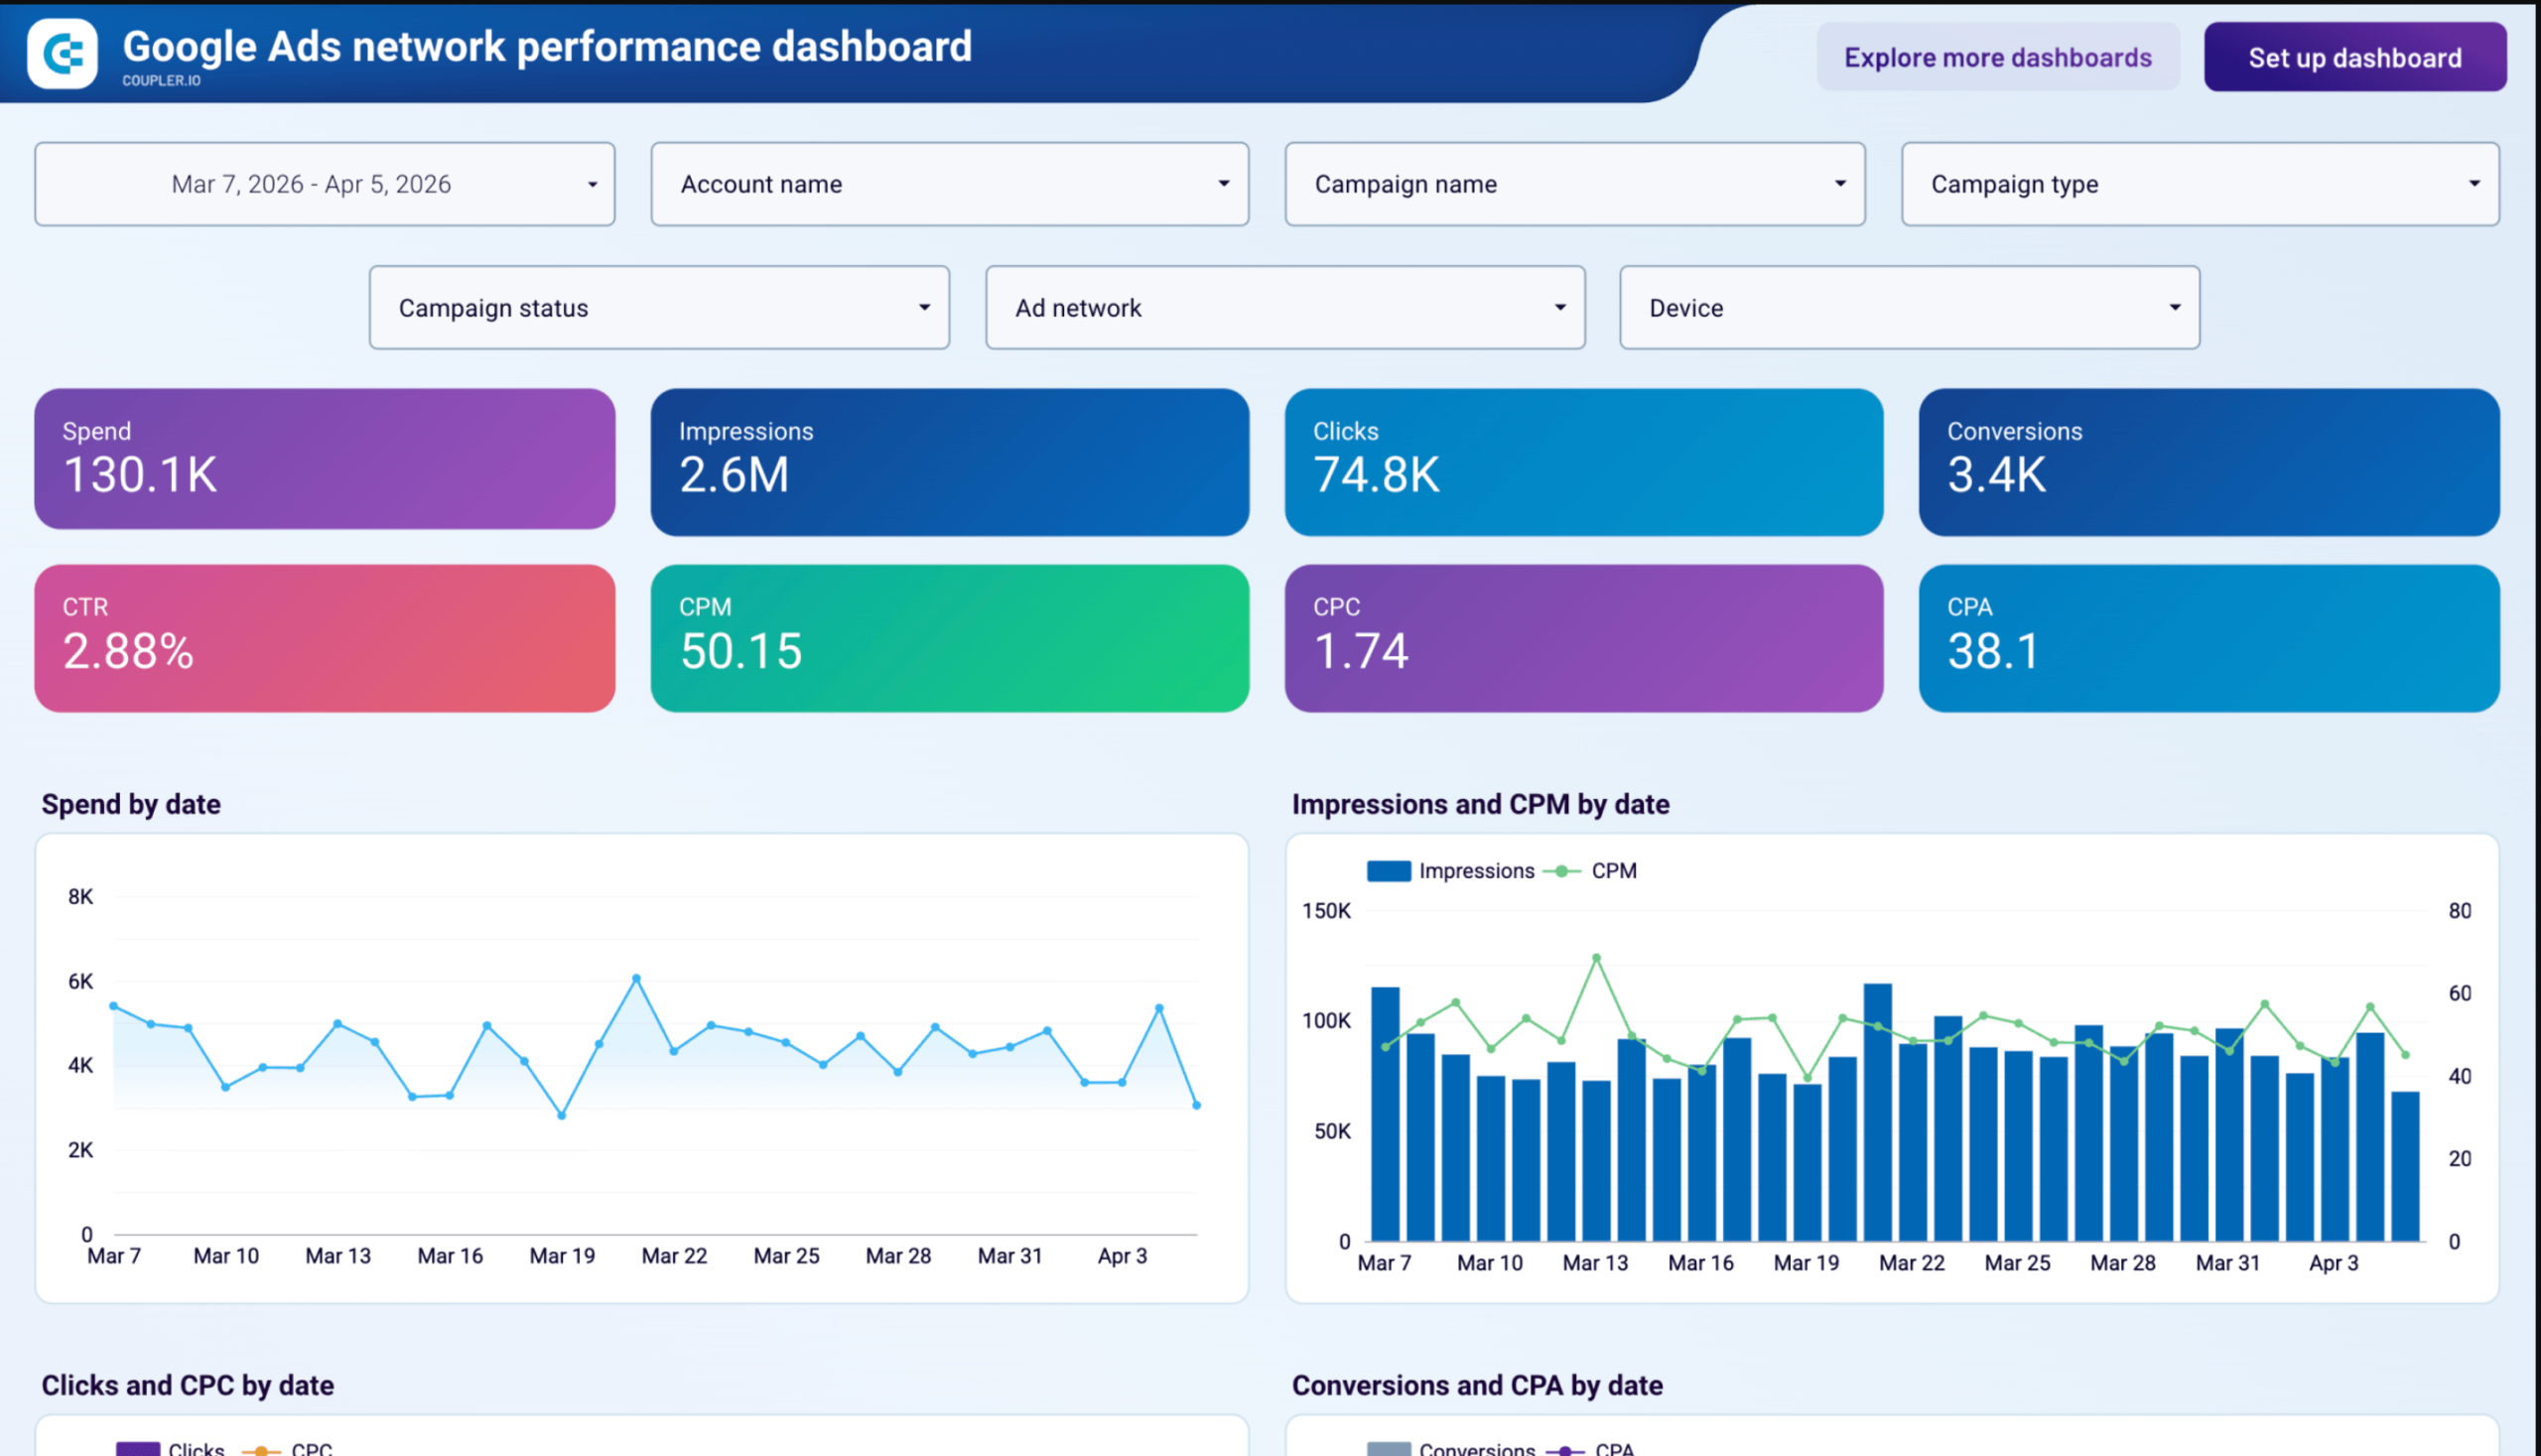
4. Google Ads network performance dashboard
The dashboard breaks your account data down by ad network, device, and geography across five pages. You can compare CPA across Search, Content, YouTube Watch, YouTube Search, and Search Partners to find which networks deliver results at your target cost, and which ones quietly drain budget.
Google Ads network performance dashboard
 Preview dashboard
Google Ads network performance dashboard
Preview dashboardThe dashboard also shows impression share per campaign with lost IS data. Additionally, you can see a conversion breakdown by action type, video creative performance with quartile completion rates, and Performance Max asset quality ratings.
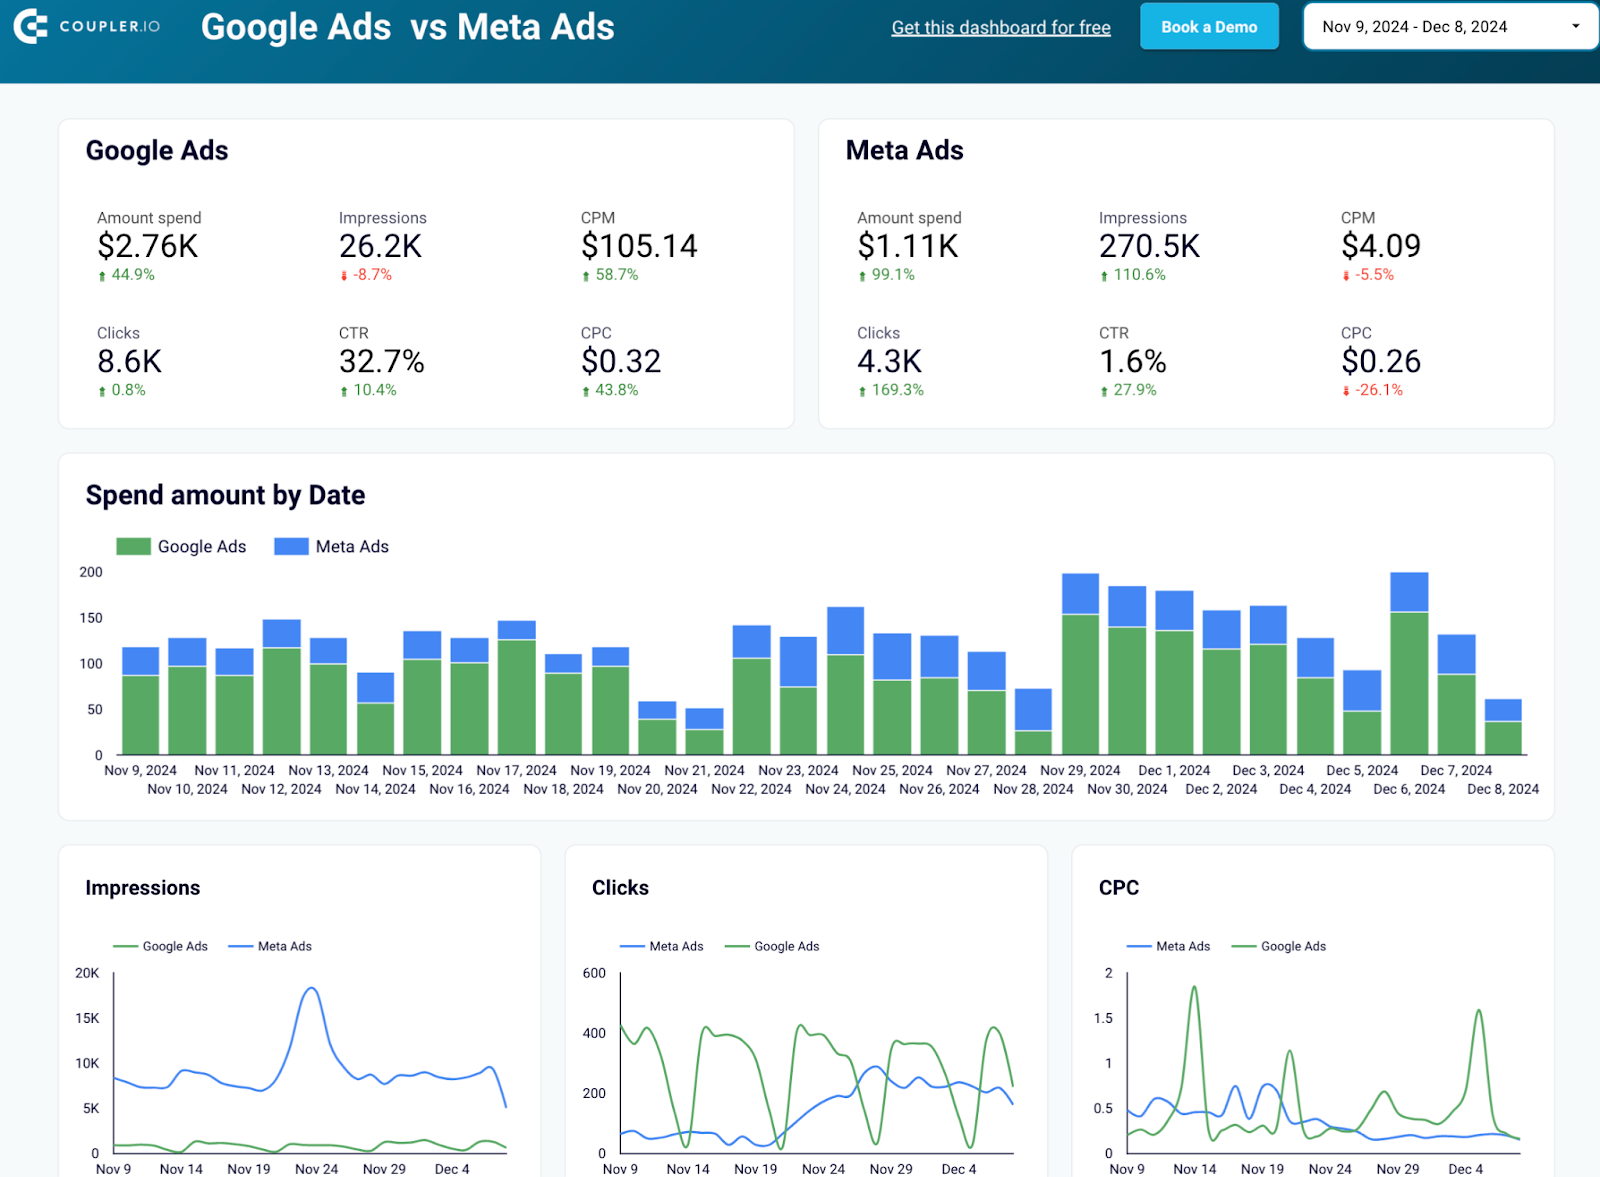
5. Google Ads vs Meta Ads comparison dashboard
Perfect for marketers running campaigns across multiple platforms, this template provides side-by-side performance analysis of your Google Ads and Meta Ads campaigns.
Google Ads vs Meta Ads dashboard
 Preview dashboard
Google Ads vs Meta Ads dashboard
Preview dashboardThe dashboard displays parallel metrics for both platforms, making it easy to compare cost efficiency, audience engagement, and conversion performance. Platform-specific trend lines reveal which channel performs better during different periods, helping you optimize budget distribution.
Campaign-level comparisons show detailed breakdowns of spend, impressions, clicks, and conversions for each platform. This data-driven approach enables informed decisions about budget reallocation and platform-specific strategy adjustments.
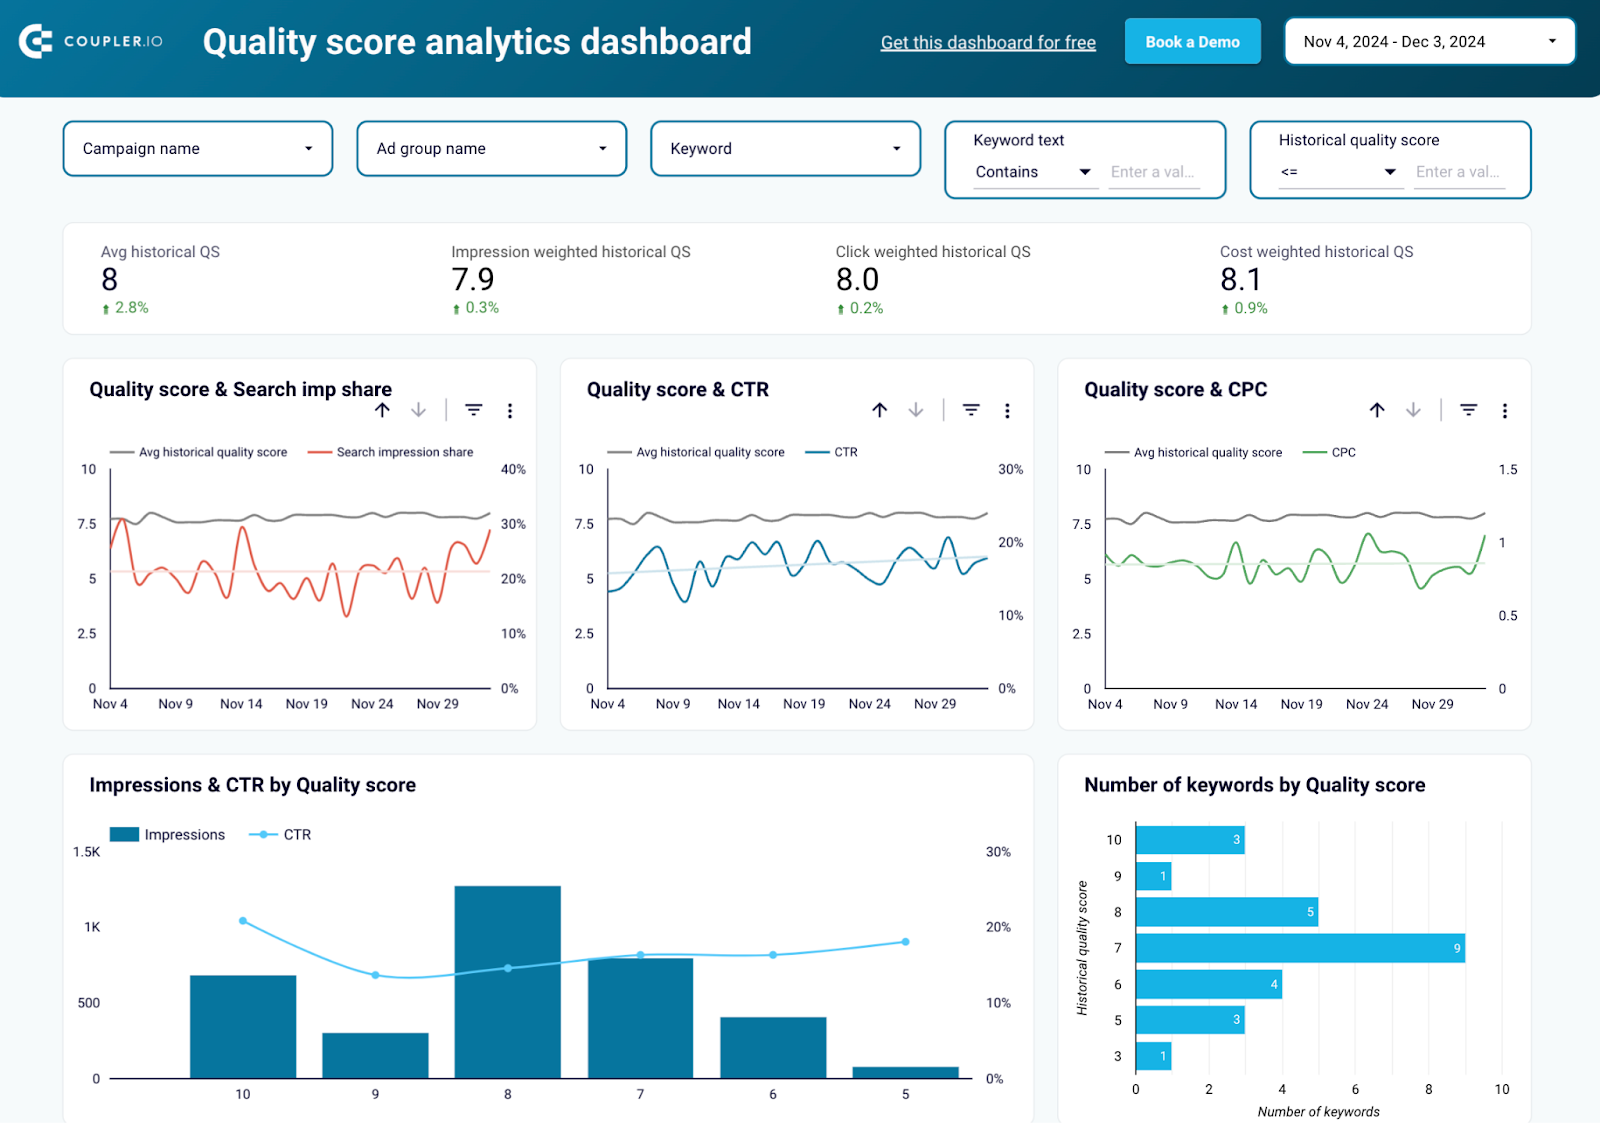
6. Google Ads quality score analytics dashboard
Improve your campaign efficiency with this specialized dashboard focused on quality score optimization and keyword performance enhancement.
Quality score analytics dashboard for Google Ads
 Preview dashboard
Quality score analytics dashboard for Google Ads
Preview dashboardThe template tracks quality score trends against key performance indicators, with detailed analysis of ad relevance, landing page experience, and expected click-through rates. Quality score distribution charts help identify keywords needing immediate attention.
Historical quality score tracking reveals the impact of optimizations over time, while weighted quality score analysis shows the financial impact of quality improvements. This dashboard is essential for reducing cost-per-click and improving ad position through quality score optimization.

Each Google Ads report template is fully automated with the help of Coupler.io’s Looker Studio connector. This means that you don’t even need to go through the settings – once you connect your Google Ads and Looker Studio accounts, the pre-configured importer will automatically pull the needed Google Ads data and visualize it, creating your own copy of this dashboard. As a result, you can have an analysis-ready self-updating dashboard literally in minutes.

Explore more Google Ads reporting dashboards with Coupler.io
Get started for freeHow to link Google Ads to Looker Studio with a native connector
- Log in to your Looker Studio account and navigate to the menu on the left.
- Click Create and select Data source.
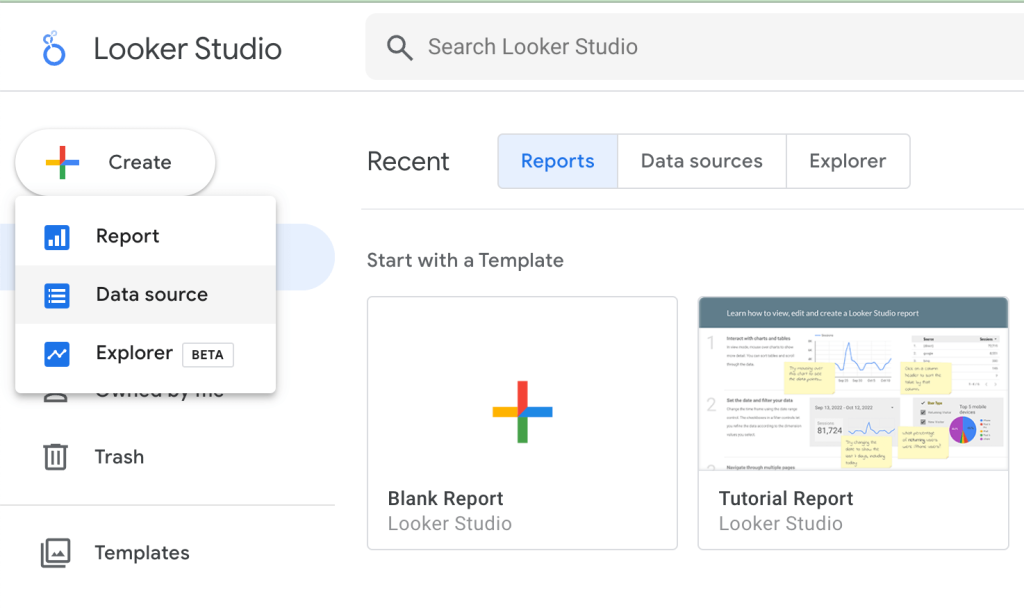
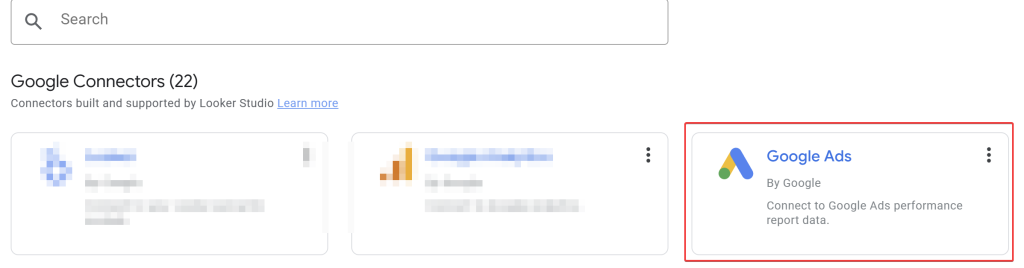
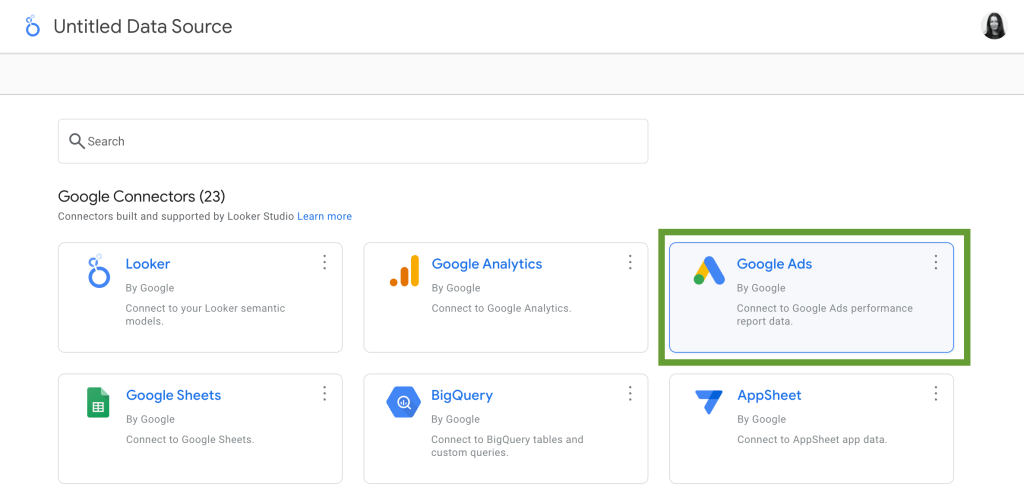
- In the next step, you will see the list of suggested native connectors. Click on the Google Ads tile.
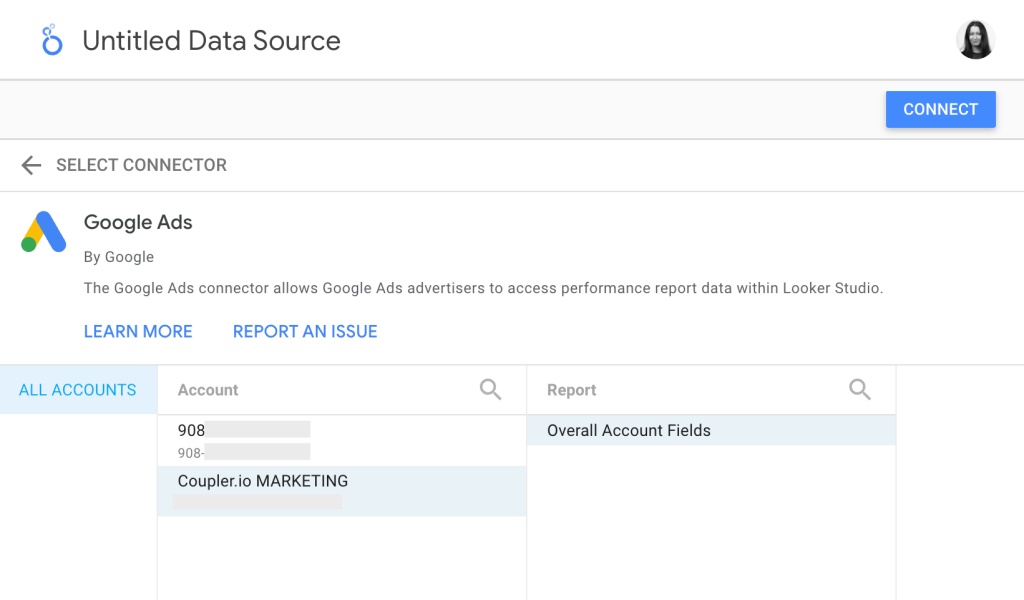
- Next, select the Account and Report you want to export data from. Then, press Connect.
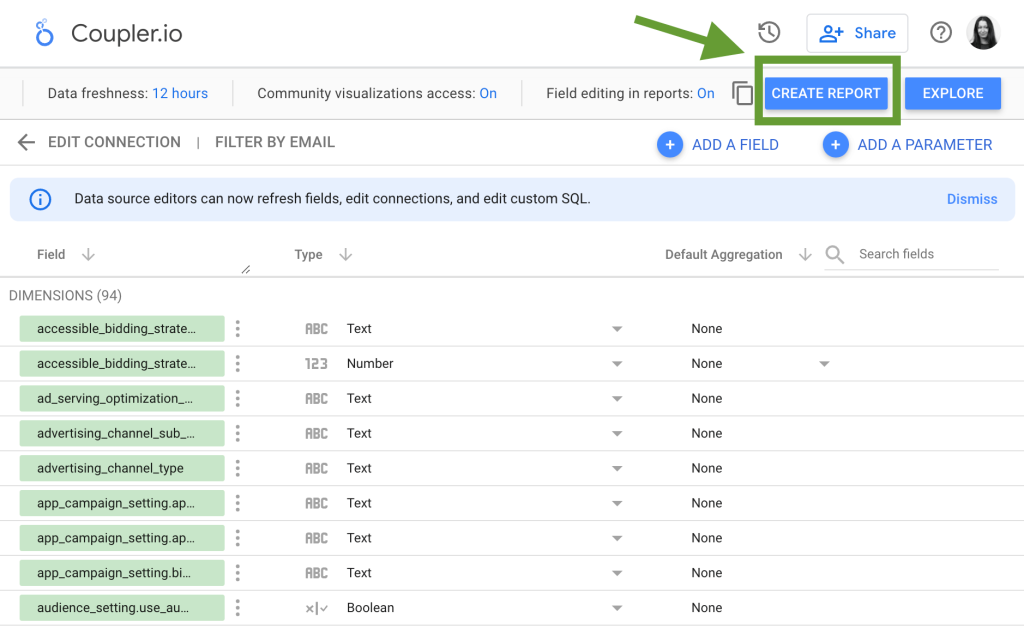
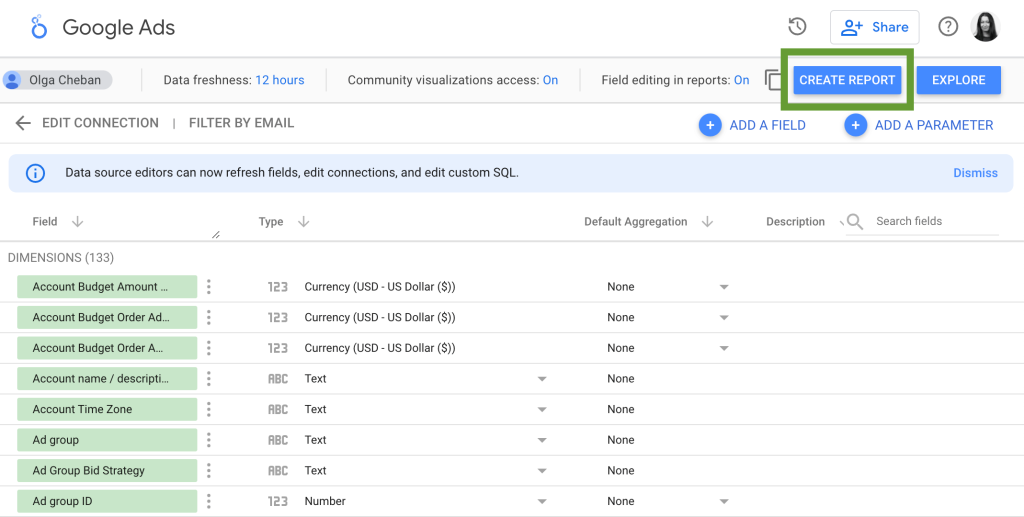
- Once this is done, you can preview the fields and the types automatically assigned to them. If some of the types are incorrect, you can press the arrow on the right and select another type manually.
- Additionally, you can check other settings in the menu on the top, such as community access and field editing.
- As for the data freshness settings, the update interval is automatically set to 12 hours.
- When everything is correct, press the Create report button in the upper right corner.
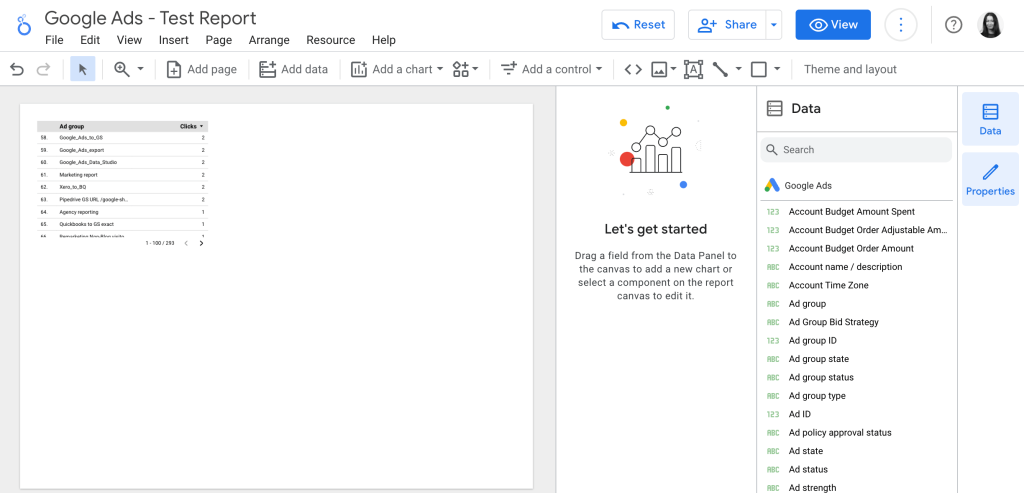
- That’s it! You’ve successfully connected Google Ads to Looker Studio, so now you can start visualizing your data.
Using the native connector is a rather simple and straightforward way to link the two apps. However, if you want to build a comprehensive cross-channel dashboard that will be updated automatically, it’s better to do so with the help of third-party solutions. We will give you a detailed example of this method in the next section.
Now that we’ve explored various ways to create a Google Ads dashboard, let’s take a look at the key metrics to include in your visualized report.
What are the most important Google Ads KPIs to track in Looker Studio?
When you connect data from Google Ads to Looker Studio, you should decide what data exactly you need. Here are some of the most important metrics to keep track of.
| Metric | Meaning | Formula |
| Clicks | The total number of times users clicked on your ad. The number of clicks indicates how relevant and appealing your ad is for the selected audience. | – |
| Impressions | This metric indicates how many times your ad has been demonstrated to the users. | – |
| Click-through rate (CTR) | This metric shows how many users from the total viewers number clicked on an ad, link, or button with a CTA (call to action). | CTR = (Clicks / Impressions)*100 |
| Cost per click (CPC) | The amount of money you pay for each click. To calculate it, divide your total budget for a Google Ads campaign by the number of clicks in that campaign. | CPC = Total cost / Clicks. |
| Conversion rate | The percentage of clicks that result in conversion – the desired action performed by the user. An example of such action can be making a purchase, subscribing to a newsletter, etc. | Conversion Rate = (Conversions / Clicks) * 100 |
| Cost/conversions (CPA) | The average cost of acquiring a conversion. To calculate it, divide your total budget for a Google Ads campaign by the number of conversions. | CPA = Total cost / Conversion |
| Conversions value/cost (ROAS) | Return on Ad Spend (ROAS) measures the financial value generated from conversions relative to the cost of the ads. | ROAS = Conversion Value / Cost |
| Quality score | This metric reflects the quality and relevance of your ads, keywords, and landing pages. Higher quality scores results in better ad position, ad rank, and cost-per-click. | Calculated by Google, the formula is not public |
For more details, see our article on Google Ads metrics.
What is the best way to connect Google Ads to Looker Studio?
In this article, we’ve explored different methods that allow you to connect Google Ads to Looker Studio. If you mostly want to visualize just one data source (Google Ads) and don’t need to perform any complex calculations, you can use native integration – it’s free and easy to use.
However, if you want to have an all-in-one solution to automate your data flows, bring all your ad and marketing data to one place, as well as give you more flexibility for custom calculations. In this case, it’s better to opt for a third-party solution. For example, you can connect Google Ads to Looker Studio automatically using Coupler.io. This data integration platform allows you to easily connect multiple data sources, blend several datasets into one, transform your data in various ways, and visualize it in minutes with readily available automated templates. You can also use Coupler.io to connect Google Ads to Tableau, Power BI, and other destinations.
Connect Google Ads to Looker Studio with Coupler.io
Get started for free