What is a data-driven marketing agency
Collecting a lot of data doesn’t make an agency data-driven. What counts is whether that data reaches your processes, strategies, reporting, and client conversations.
In practice, a data-driven agency has a few things in place:
- Connected data: Performance data from ad platforms, analytics, CRM systems, and other sources is brought into a consistent view.
- Reliable reporting: Dashboards and reports refresh automatically, so teams aren’t spending hours pulling numbers together.
- Data-informed decisions: Campaigns are adjusted based on updated performance and behavior, rather than waiting until the end of a reporting period.
- AI-assisted analysis: Teams can ask questions that aren’t already built into a dashboard, investigate changes in performance, spot patterns, and identify areas worth looking into.
AI doesn’t replace the data foundation underneath this. It makes that foundation more useful by giving teams another way to explore the data and get from a question to an answer without building a new report every time.
By 2026, most agencies have some version of this in place. What separates them now is how much of the analysis happens without someone assembling it manually.
Ronald Coase’s famous quote sums up the risk of getting this wrong:
If you torture data long enough, it will confess to anything…
Key challenges in data collection and analysis
The gap between the data an agency holds, and the data it can act on, typically comes down to a handful of recurring problems:
Data silos: Data sits across disconnected platforms, from ad accounts to CRM systems, and inconsistent naming makes it hard to blend. Multichannel marketing then gets optimized channel by channel, because nobody can see the full customer journey in one place.
Data quality: Incomplete tracking, duplicate records, and stale numbers produce reports that point the wrong way. Once a client catches a discrepancy, the reporting itself becomes the conversation.
Tool sprawl: Agencies add tools faster than they connect them. Every new platform generates its own silo, so the stack grows while visibility stays flat.
Data that isn’t ready for downstream use: Raw platform data arrives with inconsistent naming conventions, undefined metrics, mixed currencies, and different date formats. If fields aren’t labeled and metrics aren’t defined, every dashboard, spreadsheet, warehouse, and AI tool downstream inherits the mess.
Lack of expertise: Collecting data is the easy part. Transforming it into something a client can act on takes skills most agency teams don’t have on staff, so the work lands on whoever has time that week.
Privacy regulations and tracking limitations: Consent requirements and the end of the cookie era make granular attribution harder, which pushes agencies toward modeled data they need to understand before they report on it.
Left alone, these show up in marketing agency reporting as inefficient spend and missed optimization windows, then as client churn when an agency with better visibility wins the account. The right tools take most of this off the table.
Tools and data sources for data-driven agencies
Data-driven agencies rely on a mix of platforms, data sources, analytics systems, and AI. The challenge is making sure they work together, since cross-channel marketing analytics only holds up when every source lands in the same place. Your stack will depend on the type of work you do and how much of the process you want to automate.
| Category | Why it matters | Platforms |
|---|---|---|
| Web analytics | Track website traffic, audience behavior, and campaign performance | Google Analytics 4, Google Search Console |
| Paid ad platforms | Understand PPC campaigns and report on performance | Google Ads, Meta Ads, LinkedIn Ads, Amazon Ads, YouTube Ads |
| Social media platforms | Monitor post engagement and brand growth | Meta, X, TikTok, LinkedIn |
| CRM systems | Analyze the customer journey with marketing funnel analytics and track the sales pipeline | HubSpot, Salesforce, Pipedrive |
| Email marketing automation | Track email campaign results and how they affect conversions | Mailchimp, ActiveCampaign, Brevo |
| Behavioral analytics | Understand customer behavior and what drives conversions | Mixpanel, Amplitude |
| Data integration and AI analytics | Collect and organize data from business apps for automated reporting. Ask questions about consolidated data in natural language. | Coupler.io |
| BI and dashboards | Visualize data and build client-facing dashboards | Data Studio, Power BI, Tableau, Qlik |
| Spreadsheets | Quick analysis and ad hoc reporting | Google Sheets, Microsoft Excel |
| Data warehouses | Store large datasets, transform them for reporting, and query with SQL | BigQuery, Snowflake, Redshift |
| AI analytics | Analyze marketing data through a chat interface, using the dataset your integration layer already prepared. | ChatGPT, Claude, Gemini, Perplexity |
When the data lands in one organized set, a report, an analysis, or an AI question can all draw from the same underlying data. Without an integration layer, every new platform creates another disconnected set of numbers to pull together before you can make sense of them. The table above covers the analysis layer only. For the rest of the stack, from creative to AI search visibility, see AI for marketing agencies.
Coupler.io is a data integration and AI analytics platform built for exactly that. It connects to 400+ sources, organizes the data before it reaches the destination, and refreshes your report on a schedule. You can put questions to that data inside Coupler.io, or work with it in the AI tool your team already uses.

Get your client data ready for reports and AI
Book a demoMetrics to track for each client
Most agencies track more metrics than they use. These cover the ones clients usually ask about:
Website traffic and engagement: shows how your search engine optimization (SEO) and content marketing campaigns are performing.
- Organic vs. paid traffic growth
- Page views
- Exit rate of key pages
- Engagement rate
- Conversion rates
Lead generation: to map out and measure the paths to customer acquisition.
- Number of marketing qualified leads
- Cost per lead
- Lead quality through MQL to SQL
- Conversion rate
Social media performance: to pinpoint which campaigns, creatives, and messages drive the best results.
- Reach
- Impressions
- Engagement rate
- Follower growth
- Ad cost
- Content conversion rate
Email marketing performance: to understand how email campaigns impact different touchpoints.
- Open rates
- Click-through rates
- Conversion rates
Revenue metrics: to demonstrate marketing effectiveness and optimize budget allocation across channels.
- Campaign return on investment (ROI)
- Customer acquisition cost (CAC)
- Customer lifetime value (LTV)
Metrics that matter most by client type
The list above applies across the board, but the metrics a client actually cares about depend on how their business makes money. A plumbing company and a SaaS product can run the same campaigns and judge them by completely different numbers.
| Client type | Metrics that matter most |
|---|---|
| E-commerce | Conversion rate, average order value, customer acquisition cost, return rate |
| B2B and professional services | Cost per qualified lead, pipeline value, sales cycle length, close rate |
| SaaS | MRR/ARR, churn rate, trial-to-paid conversion, LTV:CAC ratio |
| Local services | Lead volume, cost per lead, booking or appointment rate, review rating |
| Hospitality and travel | Direct booking share, cost per booking, cancellation rate, revenue per available room |
That said, ROI is the ultimate measure of success for any marketing agency’s efforts.
How to automate data collection, reporting, and analysis
On average, a client monthly report requires 5 hours to prepare, while more complex reports can take over 8 hours. That’s because, in most cases, marketing experts manually build these reports using data from multiple sources. To win those hours back, agencies need a way to automate reporting for clients instead of rebuilding the same reports every month. Coupler.io takes that work off your team.
Connect your data through a chat interface
You can set up a client’s reporting by describing it. Coupler AI Agent is a chat assistant inside the platform: it configures the data flow, then answers questions about the data once it lands. Explain what you need, like automated data collection for Google Analytics and Google Ads reporting:
Let Coupler AI do the data work for you
Tell Coupler AI what you need to know, from which source, and how often. It connects your account, sets up the data flow, keeps it refreshed, and lets you analyze the results inside Coupler.io or another AI tool.
Try for free
You can connect data from multiple business apps and organize it on the go. Simply ask for unused columns to be dropped, daily numbers rolled up to weekly, campaign names standardized across platforms, or test and branded campaigns filtered out.
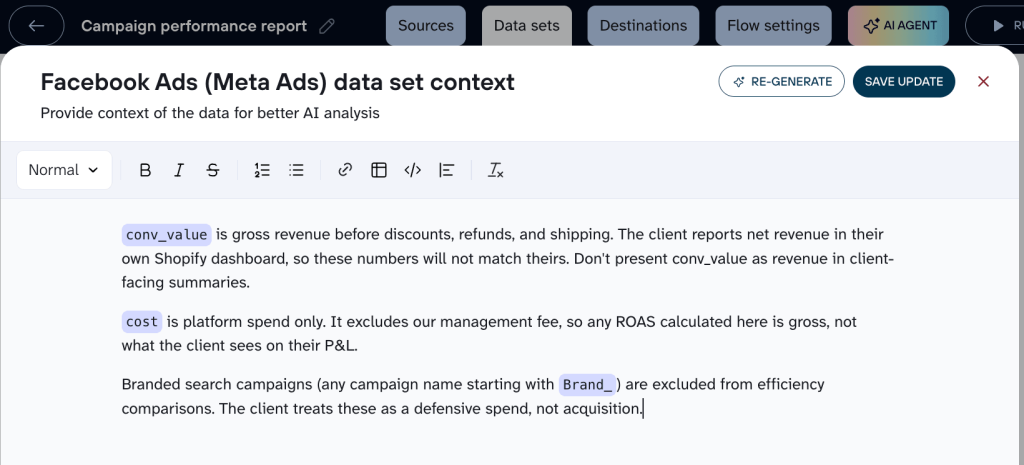
The step worth more of your time is business context: how this client defines a metric, what a field actually measures, which campaigns to leave out of comparisons. Written down once in Coupler.io, it carries into every dashboard and every AI answer built on that data.
Get a client report without building it from scratch
What comes out of the setup is prepared data, not a finished report. That data can be sent to Google Sheets, Excel, Data Studio, Power BI, Tableau, BigQuery, and AI tools at once, so the client dashboard and your internal analysis run off the same numbers.
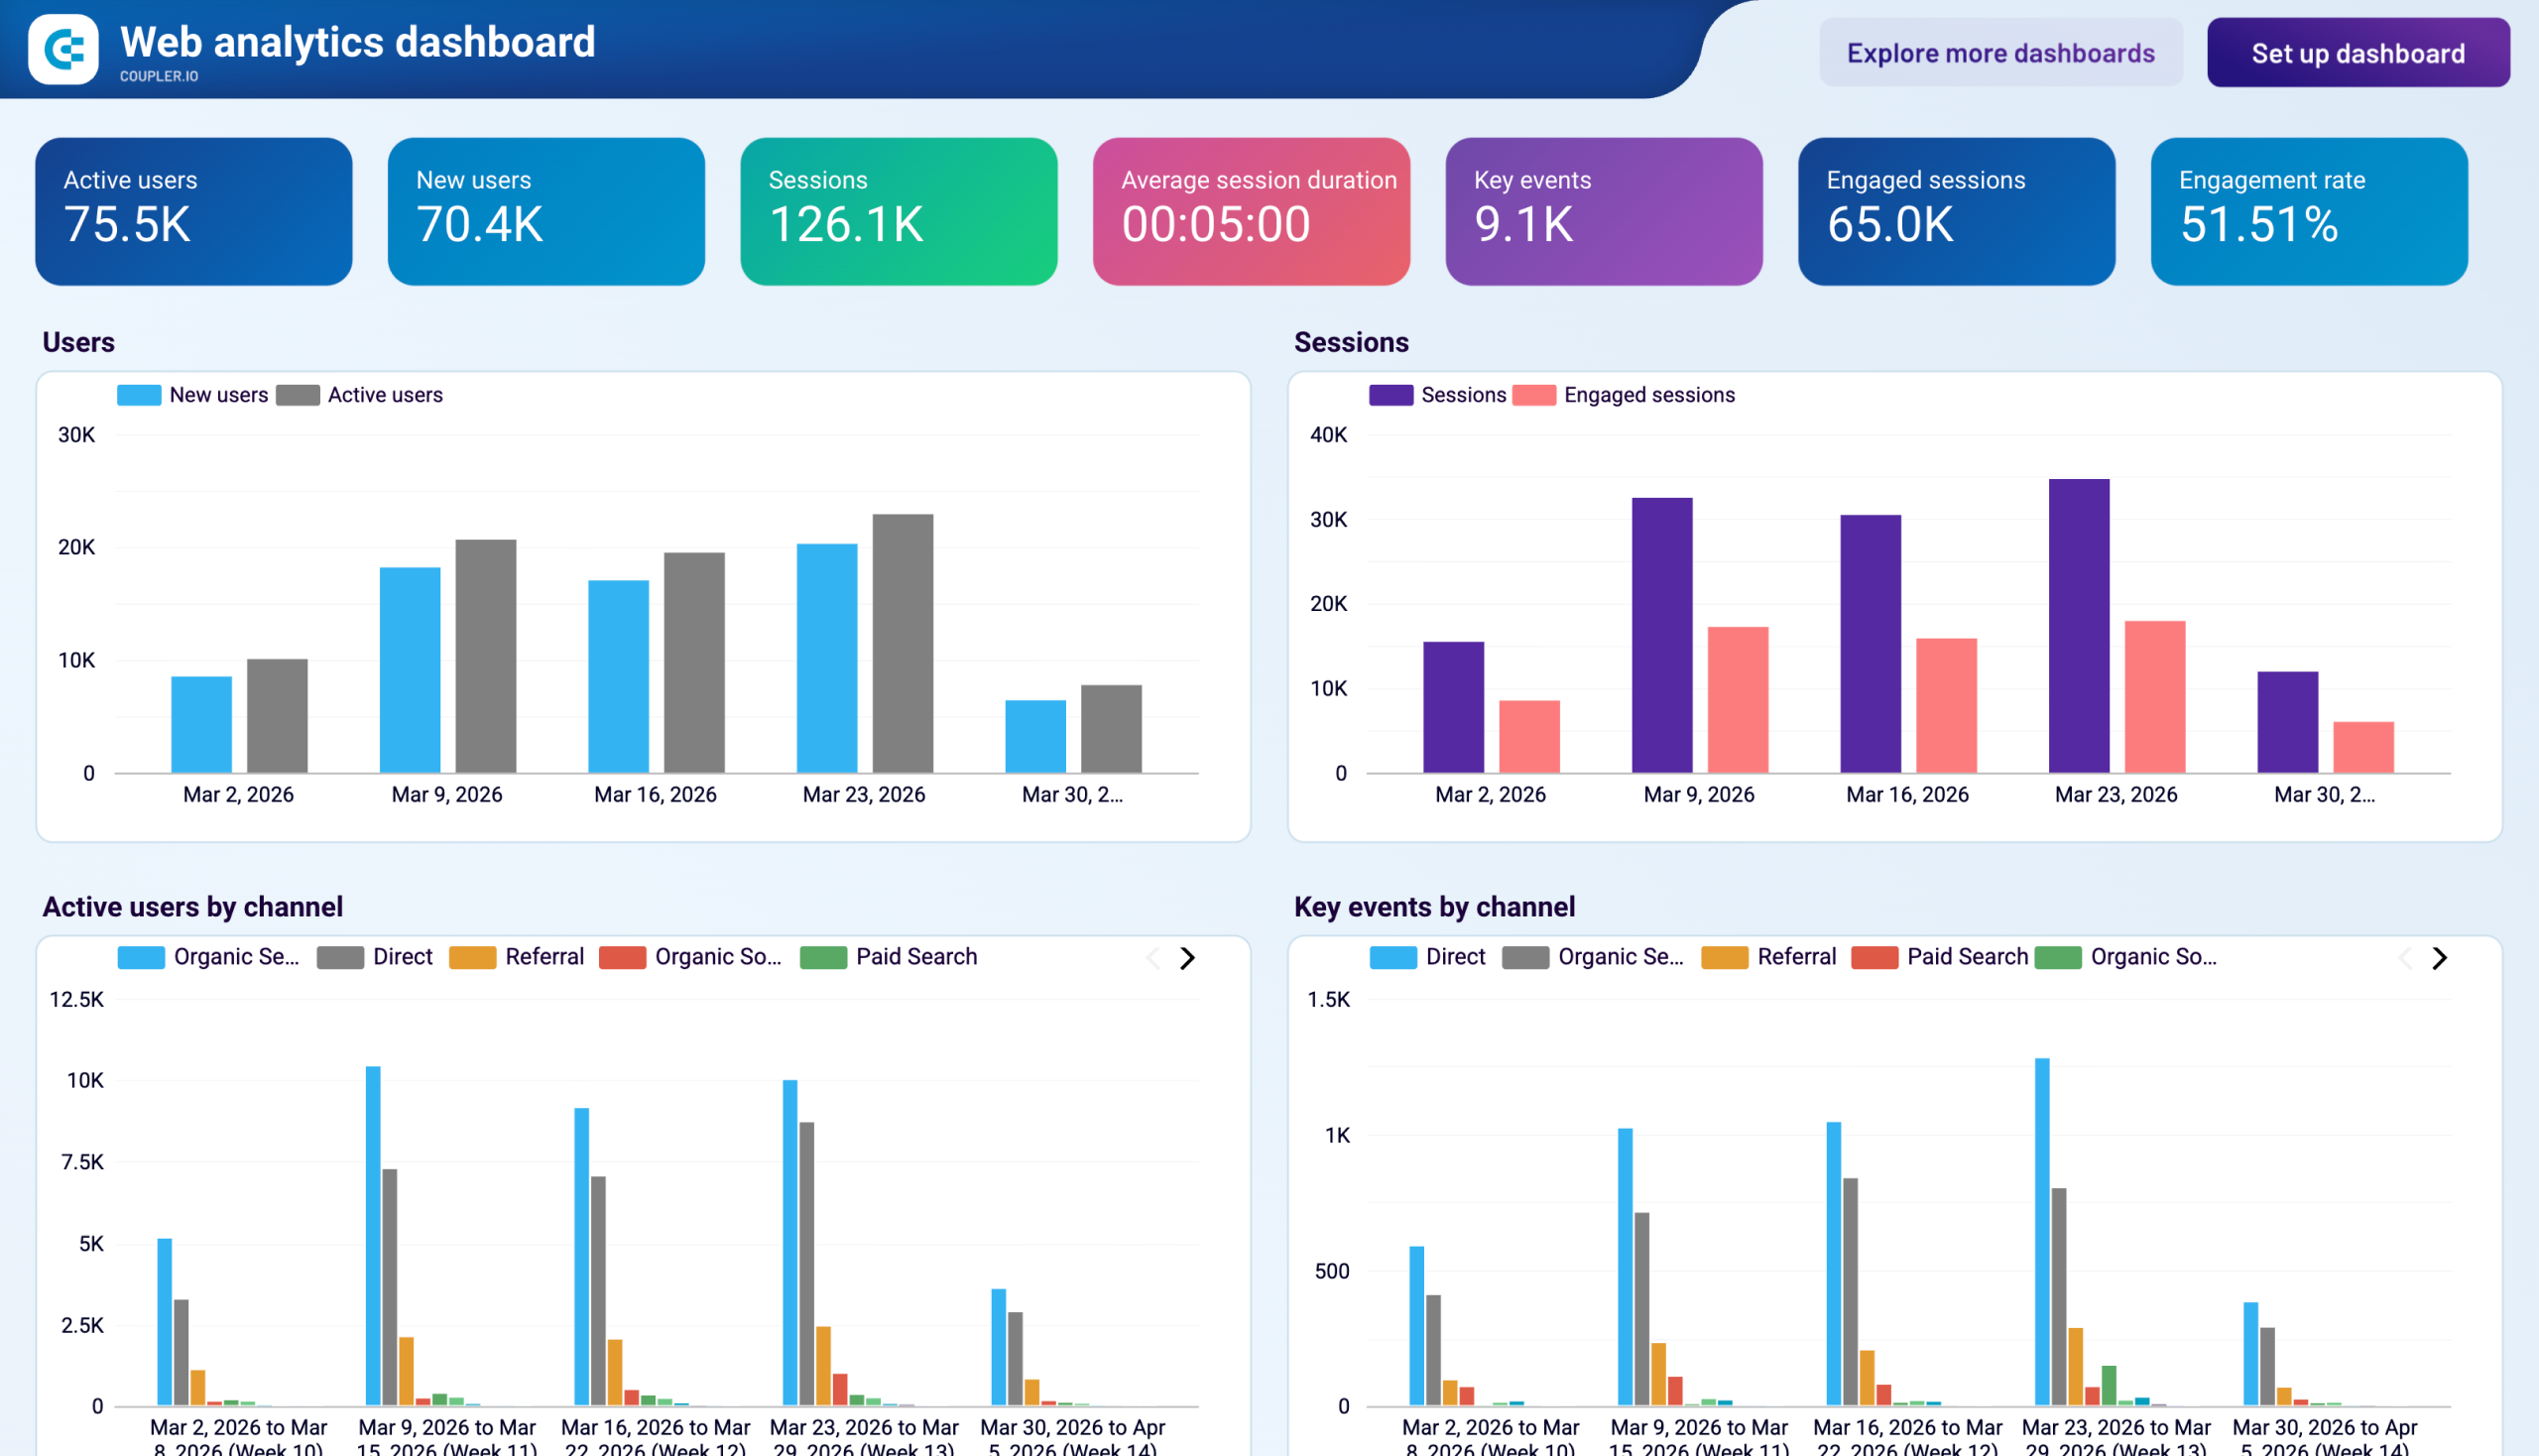
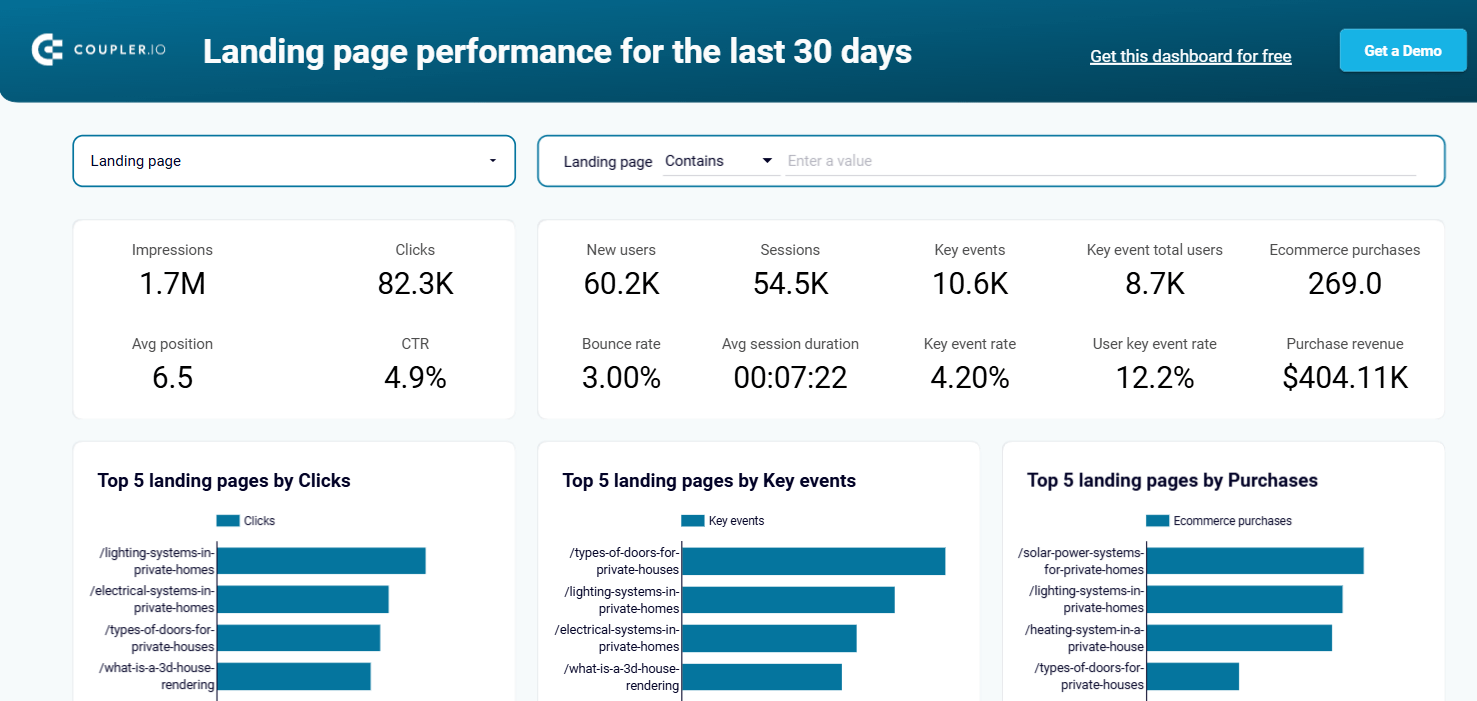
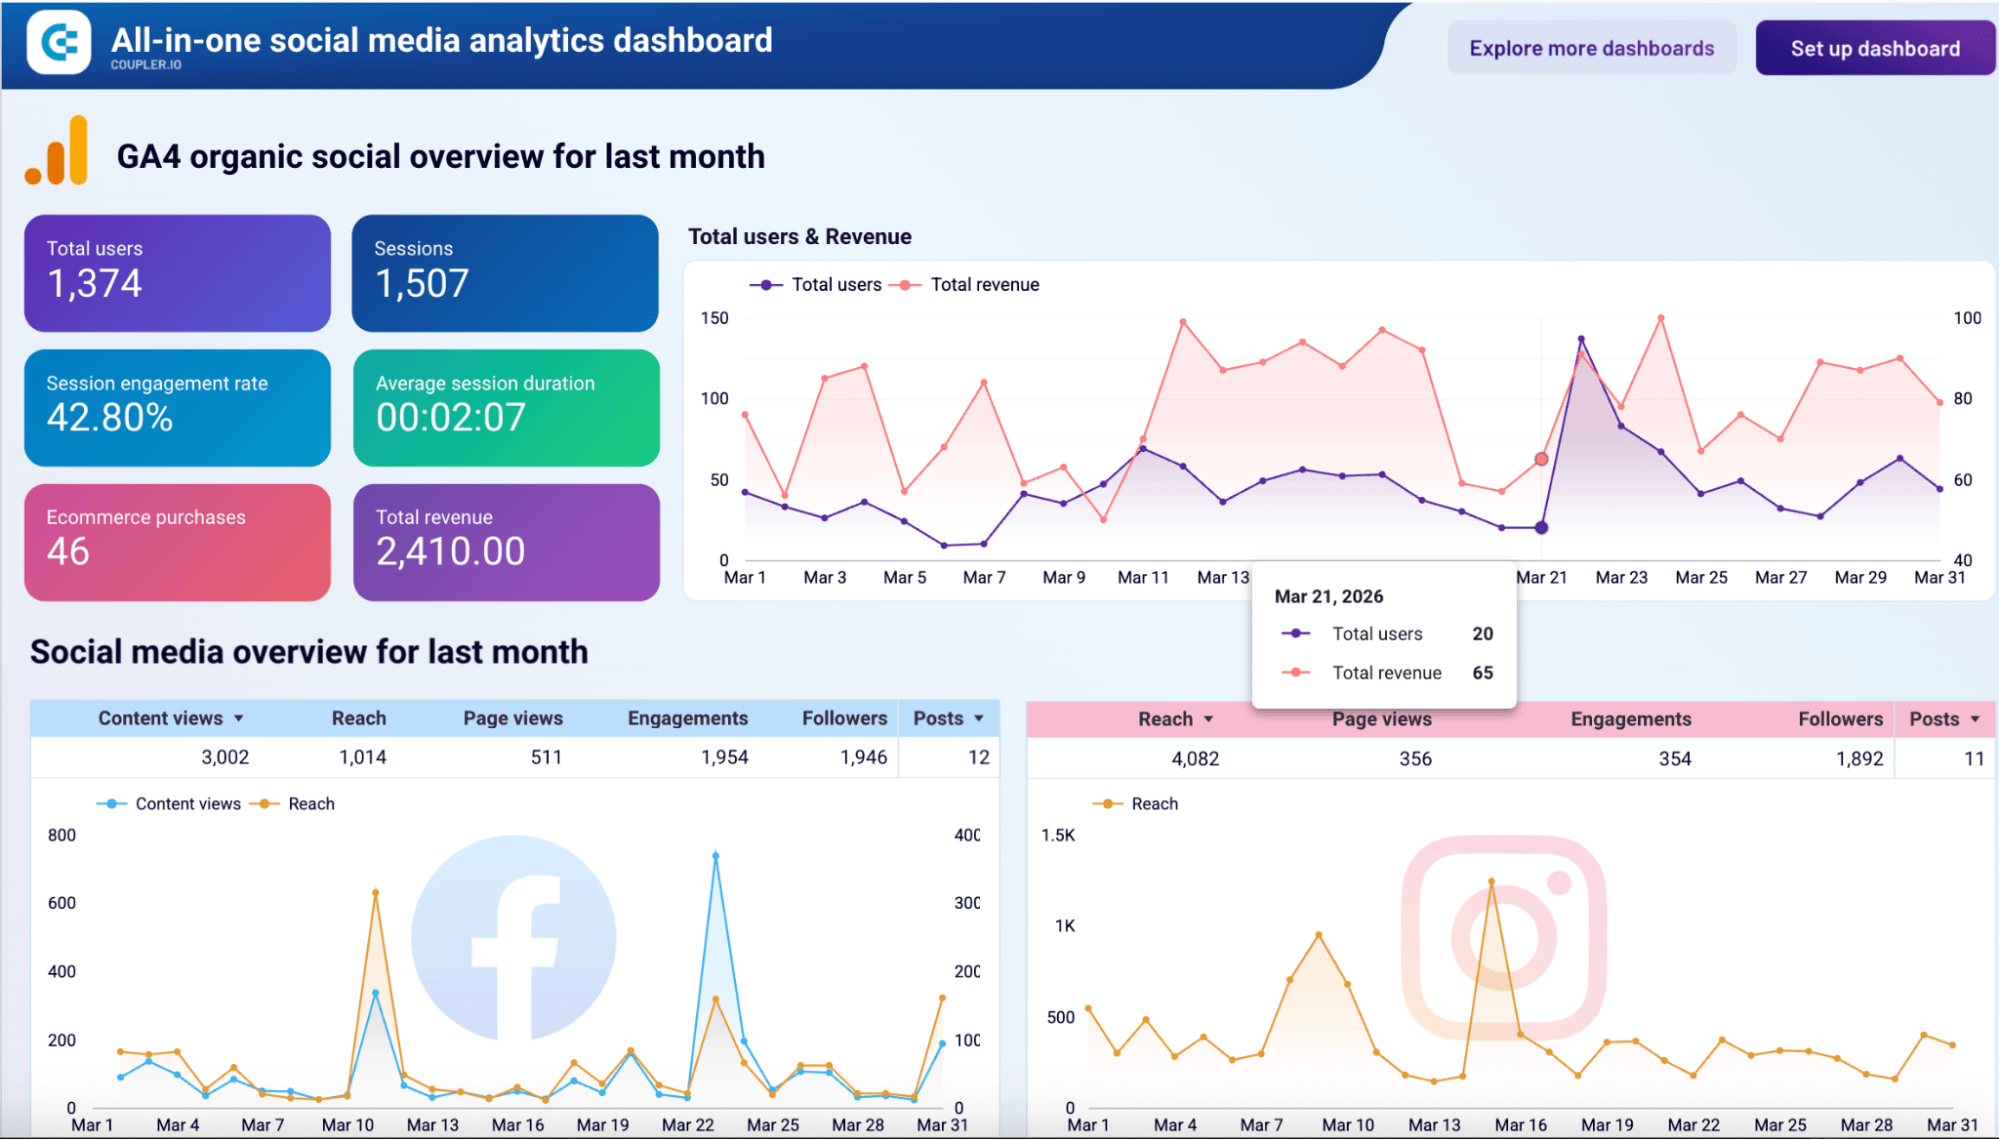
You won’t be starting from a blank canvas at the destination either. There are 210+ dashboard templates covering the standard channel and funnel views. Choose one for the next client’s accounts and it’s ready with their numbers in minutes. Here are some examples:





Answer client questions without opening the dashboard
Clients don’t hold their questions until the monthly report. When one asks why leads dropped last week, you can put that question to their data inside Coupler.io and answer the same day. The Analytical Engine performs the calculation and the model explains the result, so the number in the answer matches the number in the dashboard.
Ask for a channel breakdown or a month-over-month comparison and you get a written report you can take into a client call. The questions you ask every month don’t need rewriting each time either: Coupler AI comes with pre-built workflows for campaign audits and cross-channel performance, and it works from Claude, ChatGPT, Gemini, or Perplexity if that’s where your team already spends its day.
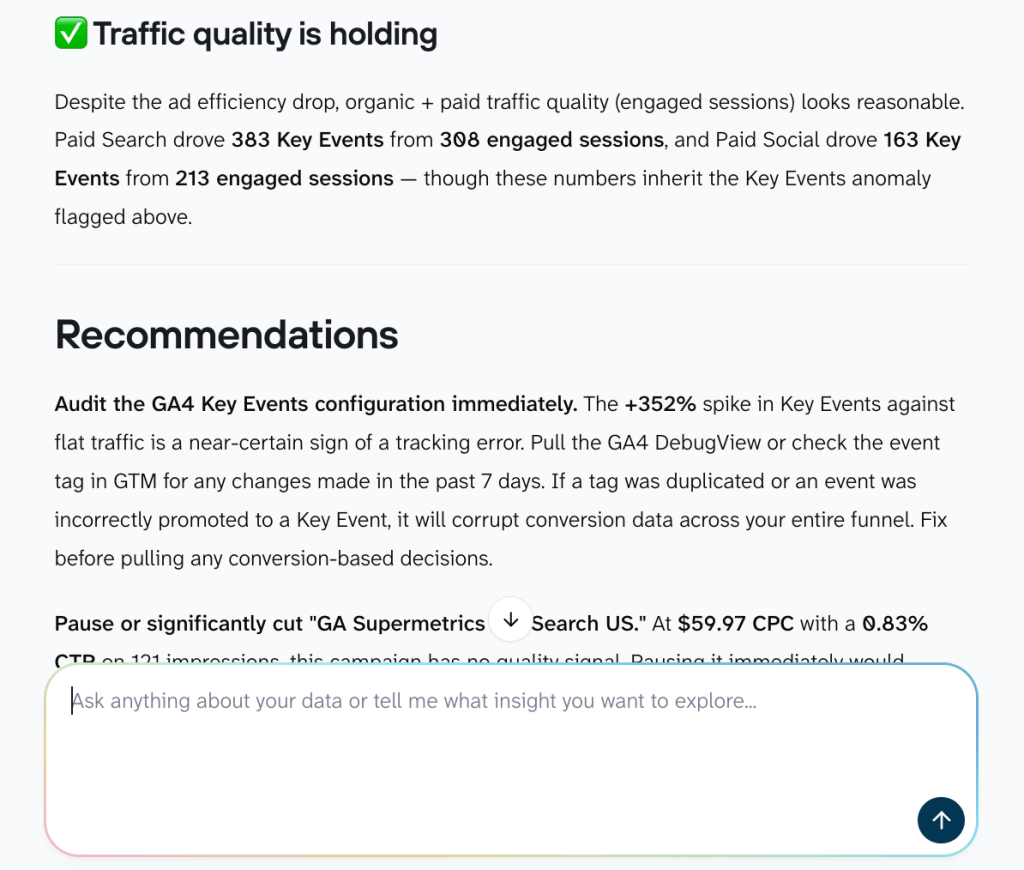
None of this reaches a client’s ad accounts or CRM directly. It works with the data you set up earlier, so what you dropped or kept decides what any AI tool can see.
Keep client reports up to date automatically
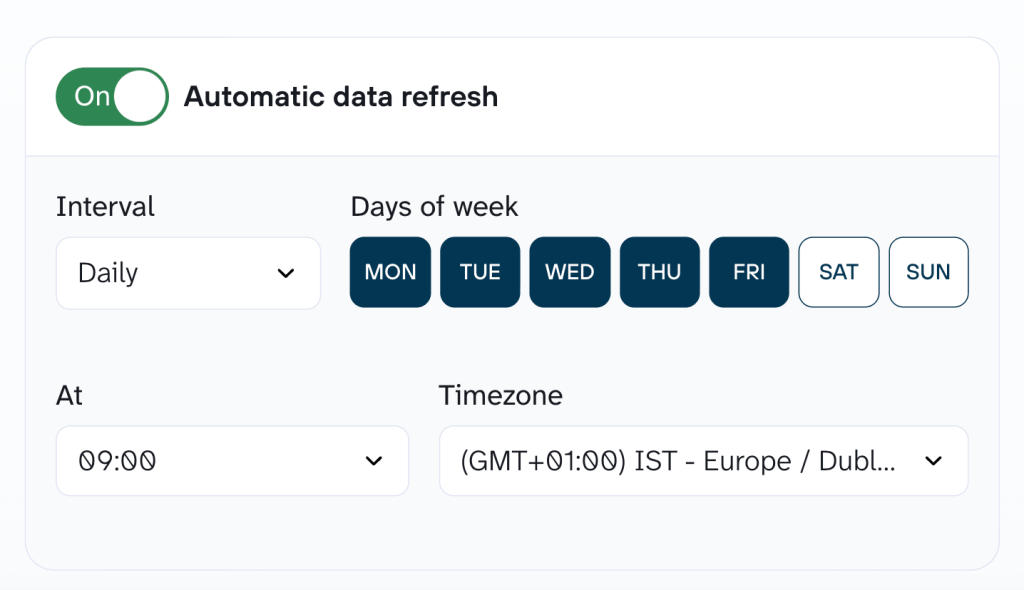
Set the refresh schedule when you connect the data. You pick how often it runs, hourly, daily, or weekly, and which days and times it should run on, so the data lands before your team or your client looks at it. An agency reporting on Monday mornings would schedule the refresh for Sunday night or early Monday.
That’s also what makes automated reporting scale past a handful of clients. The work of adding the tenth client is the work of connecting their accounts, not another recurring block in someone’s week.
Data-driven marketing examples
Both agencies below had the same underlying problem: the data existed, it just wasn’t usable without hours of manual work first. What they did about it differs, and the second one shows where this goes once the data is connected.
Cross-platform reporting in 15 minutes a week
Problem: Clear Performance Ads runs paid campaigns across Google Ads, Meta Ads, and Amazon Ads. Each platform kept its own numbers, so founder Lance Johnson was logging into all three, pulling figures by hand, and stitching them together before any analysis could start. For e-commerce clients he needed revenue, ROAS, and purchases across channels; for lead-gen clients, cost per lead.
Solution: He connected the platforms with Coupler.io and pointed them at client dashboards that update on their own. Clients see their own dashboard rather than waiting for a monthly deck, which has cut down on check-in requests.
Result: all client reporting handled in 15 minutes a week, with one person running the entire operation.
Cutting PPC analysis time by 60% with AI
Problem: Gabe Solberg manages over $1 million in monthly Meta spend for B2B SaaS clients at Right Percent. Daily CPL checks, creative fatigue analysis, weekly stakeholder reporting, and forecasting all depended on manual data pulls that couldn’t keep pace with how fast performance shifted.
Solution: He connected Meta Ads to Claude through Coupler.io’s AI Integrations. When he asks a question, Claude writes the query, Coupler.io’s Analytical Engine runs it against the data and validates the output, and Claude explains the verified result. Rolling 3 and 7 day fatigue analysis catches declining ads before they burn through budget, which matters at $40,000 of daily spend across 50+ live ads.
Result: 60% less time on analysis and reporting, with daily account health checks down to under 10 minutes.
Cut hours off your multi-client reporting with Coupler.io
Book a callBest practices for running a data-driven agency
Once the data is flowing, the work shifts to keeping it accurate, keeping it secure, and keeping clients reading it.
Protect client data
GDPR and CCPA compliance is the baseline. For agencies the exposure is doubled: you’re handling data that belongs to someone else’s customers, under a contract that says how. Be sure to document:
- what type of data you collect
- where it’s stored
- how long you keep it
- who can access it
Retention windows matter too, and data you no longer need is a liability. Set role-based access in every tool so a freelancer on one account can’t open another client’s revenue data.
AI tools follow the same logic. Scope is set at the data organization stage through the columns you keep, the fields you hide, and the filters you apply before delivery. The AI works with that dataset and never touches the source platform. Coupler.io is SOC 2 Type II certified and compliant with GDPR, HIPAA, and DORA.
Avoid analysis paralysis
With all the platforms digital marketing agencies use, it’s easy to get lost in a sea of metrics and reports. This is called “analysis paralysis.”
To avoid this, focus on metrics that drive actual business decisions. Instead of tracking everything possible, identify the top three to five relevant KPIs for every client.
For example, for an e-commerce client, these would be conversion rate, average order value, and customer acquisition cost.
When building reports and dashboards, place the key information at the top to show important metrics while keeping additional data accessible on separate pages.

This will make data less overwhelming and give you a clear path to better decisions that impact business goals.
Maintain data quality
Bad data leads to bad decisions, and clients will notice when the numbers don’t add up. Standardize campaign naming across platforms first. Inconsistent naming makes blending harder and cleaning up a year’s worth of history is a lot more work.
Then check each client’s data:
- Is the right data being tracked and can you access it?
- Is it refreshing, or are you working from an old export?
- Are duplicate records affecting the numbers?
- Do the metrics line up across platforms?
GA4 and Google Ads won’t match exactly because they use different attribution windows. A small gap is normal, but a large one is worth checking.
You also need to agree on what each metric means. Conv_value could mean gross revenue for one client and net revenue for another. Coupler.io’s business context feature lets you define these fields so the meaning carries through to dashboards and AI queries.
Scale data operations
Reporting workload grows with every client you add. The work itself doesn’t get harder, there’s just more of it, and at some point it’s someone’s full-time job. Be sure to automate:
- Onboarding. Use marketing reporting templates instead of building reports per client, or describe the setup to AI Agent and let it configure the data flow through chat.
- Recurring analysis. If you run the same campaign audit monthly for every client, AI Skills covers it as a pre-built workflow, so the review runs the same way across accounts.
- Monitoring. Alerts on conversion drops, spend nearing budget caps, and failed refreshes mean you find out the same day. A refresh that fails silently is worse than no dashboard, because the client reads last week’s numbers as this week’s.
Scale brings a second problem the automation above doesn’t touch: as the roster and the team grow, everyone can see everything. Separate spaces per client fix that, so a new hire starts with access to their accounts only and a departing client can be removed without disturbing anyone else’s reporting.
In Coupler.io, that’s managed with Organizations & Workspaces. Each workspace holds its own connections, dashboards, and people, and the organization above them keeps everything on one subscription. You reach all of it from a single login. For clients who want to own their setup, you can build it in an account under their name, hand it over, and step away.
Report in the client’s language
A client who doesn’t understand the report won’t act on it, and won’t value it either. Describe the work in terms of their revenue: which channels produce leads, which ones waste budget. Multi-touch attribution can be what you build, but it isn’t what you sell.
Start with one dashboard the client will open. If they’ve never read the full analytics report, build a one-page summary with the metrics tied to their revenue and keep everything else a click away.
Then use it to answer their questions before yours. When a client asks why their cost per lead went up this quarter, answer that with data first. The broader analysis comes after, once they trust the numbers in front of them.
First steps for your agency
None of this needs a full stack in place. Start with one client and one report, then repeat the setup for the next account once it works.
1. Pick the KPIs that matter for each client, tied to their business goals rather than what’s easy to report.
2. Connect your first couple of data sources and set them to refresh on a schedule.
3. Build one client-facing dashboard with those KPIs at the top. Use white-label templates of reporting dashboards for clients or AI to speed up delivery.
4. Add AI queries to your workflow: ask questions about last month’s performance that would have taken manual review across accounts.
Automate marketing agency reporting with Coupler.io
Get started for free