LinkedIn Ads performance is a measure of how efficient your advertisement campaigns on LinkedIn are. You can evaluate performance by tracking essential metrics. These include click-through rate, cost per click, conversions, and so on. How do you track those? What tools to use? Which benchmarks to follow? In this article, you’ll find answers to these and other questions about measuring LinkedIn Ads performance.
How can you evaluate the performance of LinkedIn Ads?
Basically, you have two options to set up and run your performance tracking: LinkedIn Ads Campaign Manager and a custom dashboard.
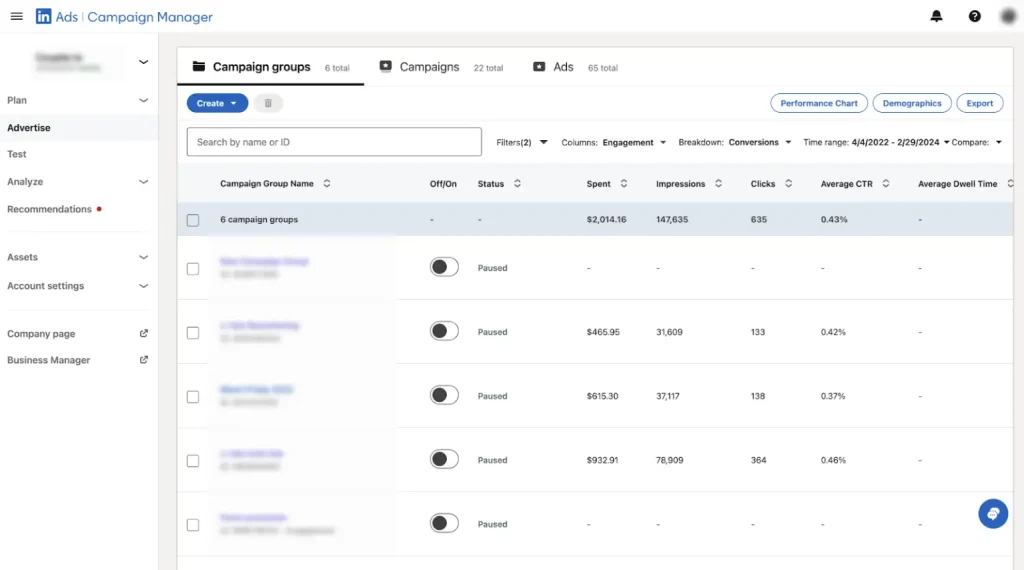
The Campaign Manager in LinkedIn is a solution for creating and launching advertising campaigns. It comes with its own dashboard, through which you can manage and track the performance of your LinkedIn advertising campaigns.
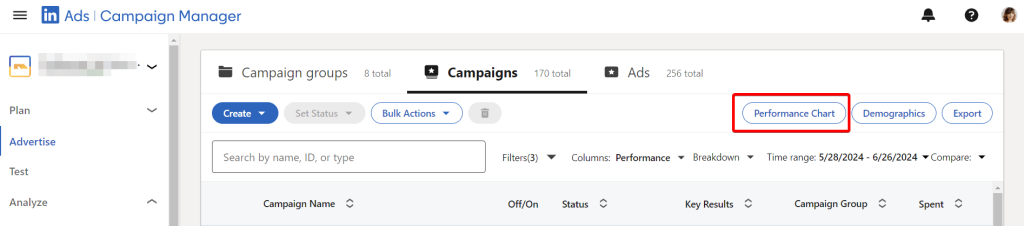
The Campaign Manager provides a built-in tool to analyze performance – Performance Chart.
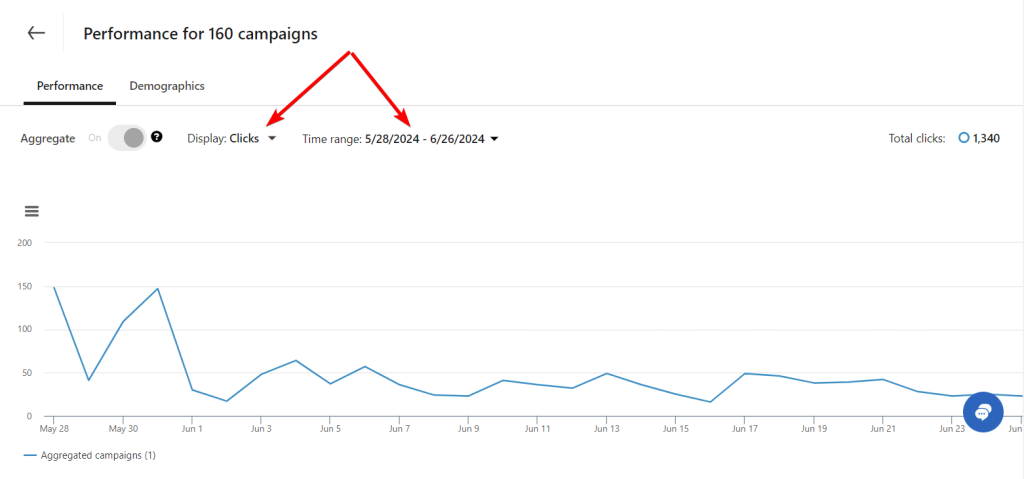
Once you click on it, you’ll get a chart showing the performance of the selected campaigns per month. You can choose metrics to evaluate performance, such as clicks, conversions, average CTR, average cost per lead, etc. You can also change the time range for this evaluation.
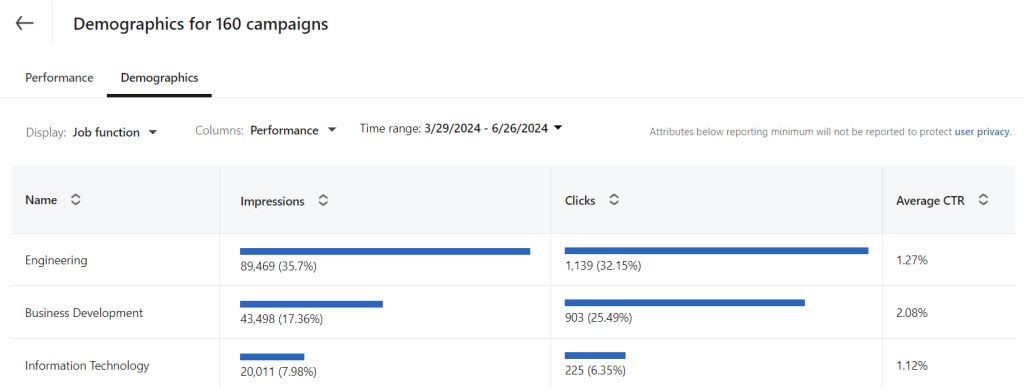
In addition to this performance chart, you also get demographics analytics on a separate tab. It shows the performance through impressions, clicks, and CTR through job functions throughout LinkedIn.
As you can see, the native analytics in LinkedIn Campaign Manager is quite simple and does not require any additional manipulations. Such a basic approach can be a go at the very beginning of your performance analysis. However, in time, you realize that you need more of that to reveal insights that can be valuable for decision-making. In this case, consider creating a custom dashboard to track LinkedIn Ads performance.
What is a LinkedIn Ads performance dashboard, and why do you need it?
A LinkedIn Ads dashboard is a tool for tracking and analyzing the performance of your LinkedIn Ads campaigns. It allows you to identify trends, patterns, and insights that may not be immediately obvious from the raw data.
Having all of your LinkedIn Ads performance data in one place allows you to make informed decisions, adjust your strategy as needed, and ultimately drive better results for your business. Moreover, you can tailor your custom dashboard to combine performance data from other digital advertising platforms, including Facebook, Google, and more. This way, you obtain a comprehensive view of your entire marketing performance.
What insights a custom performance dashboard can provide
Of course, dashboards differ, and the composition of metrics on them is not constant. However, here are a few examples of insights that a solid performance dashboard for LinkedIn Ads can offer.
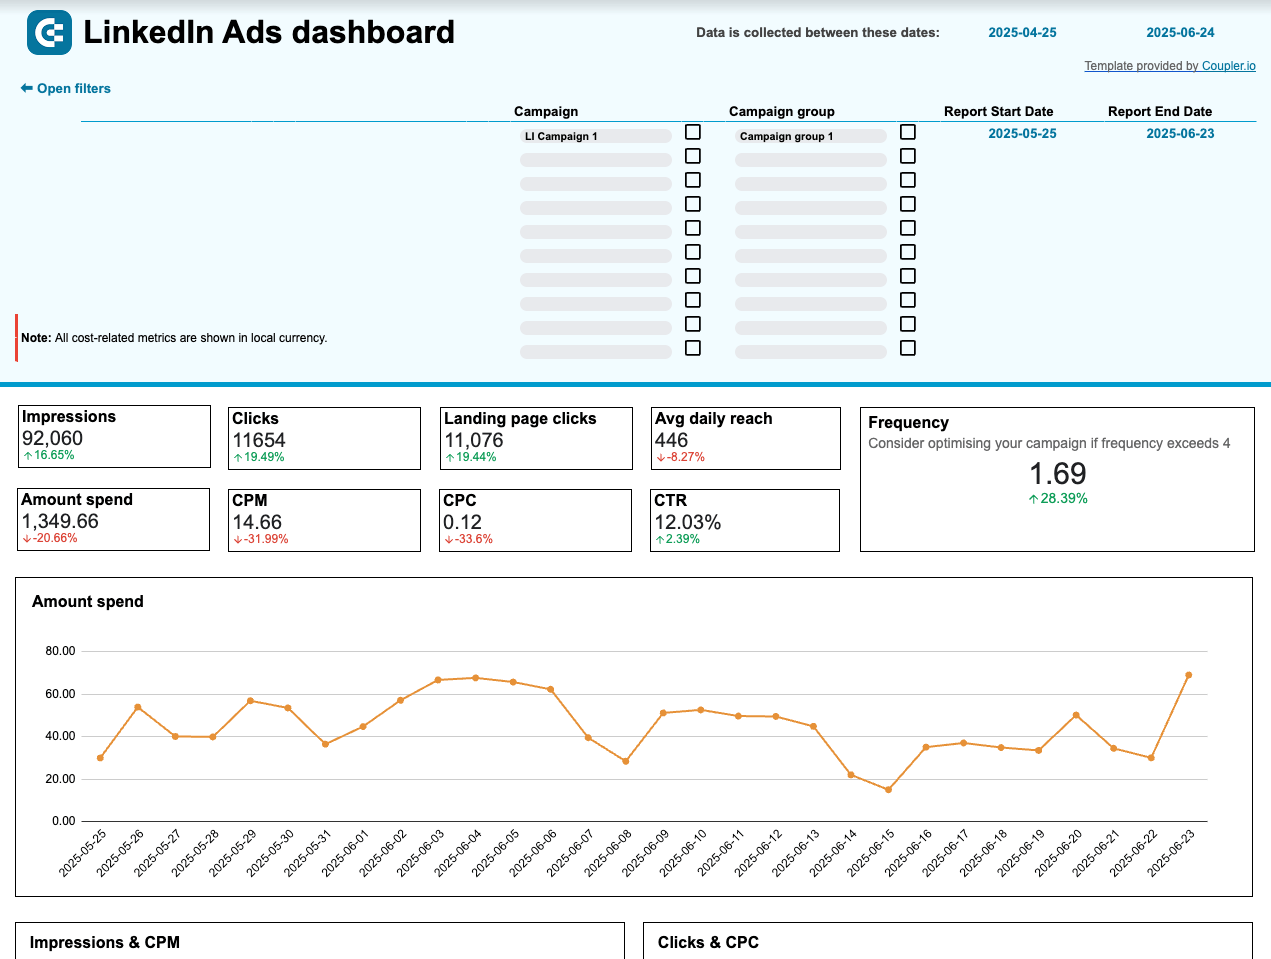
Overview of key performance metrics
LinkedIn Ads dashboard in Looker Studio
 Preview on dashboard
LinkedIn Ads dashboard in Looker Studio
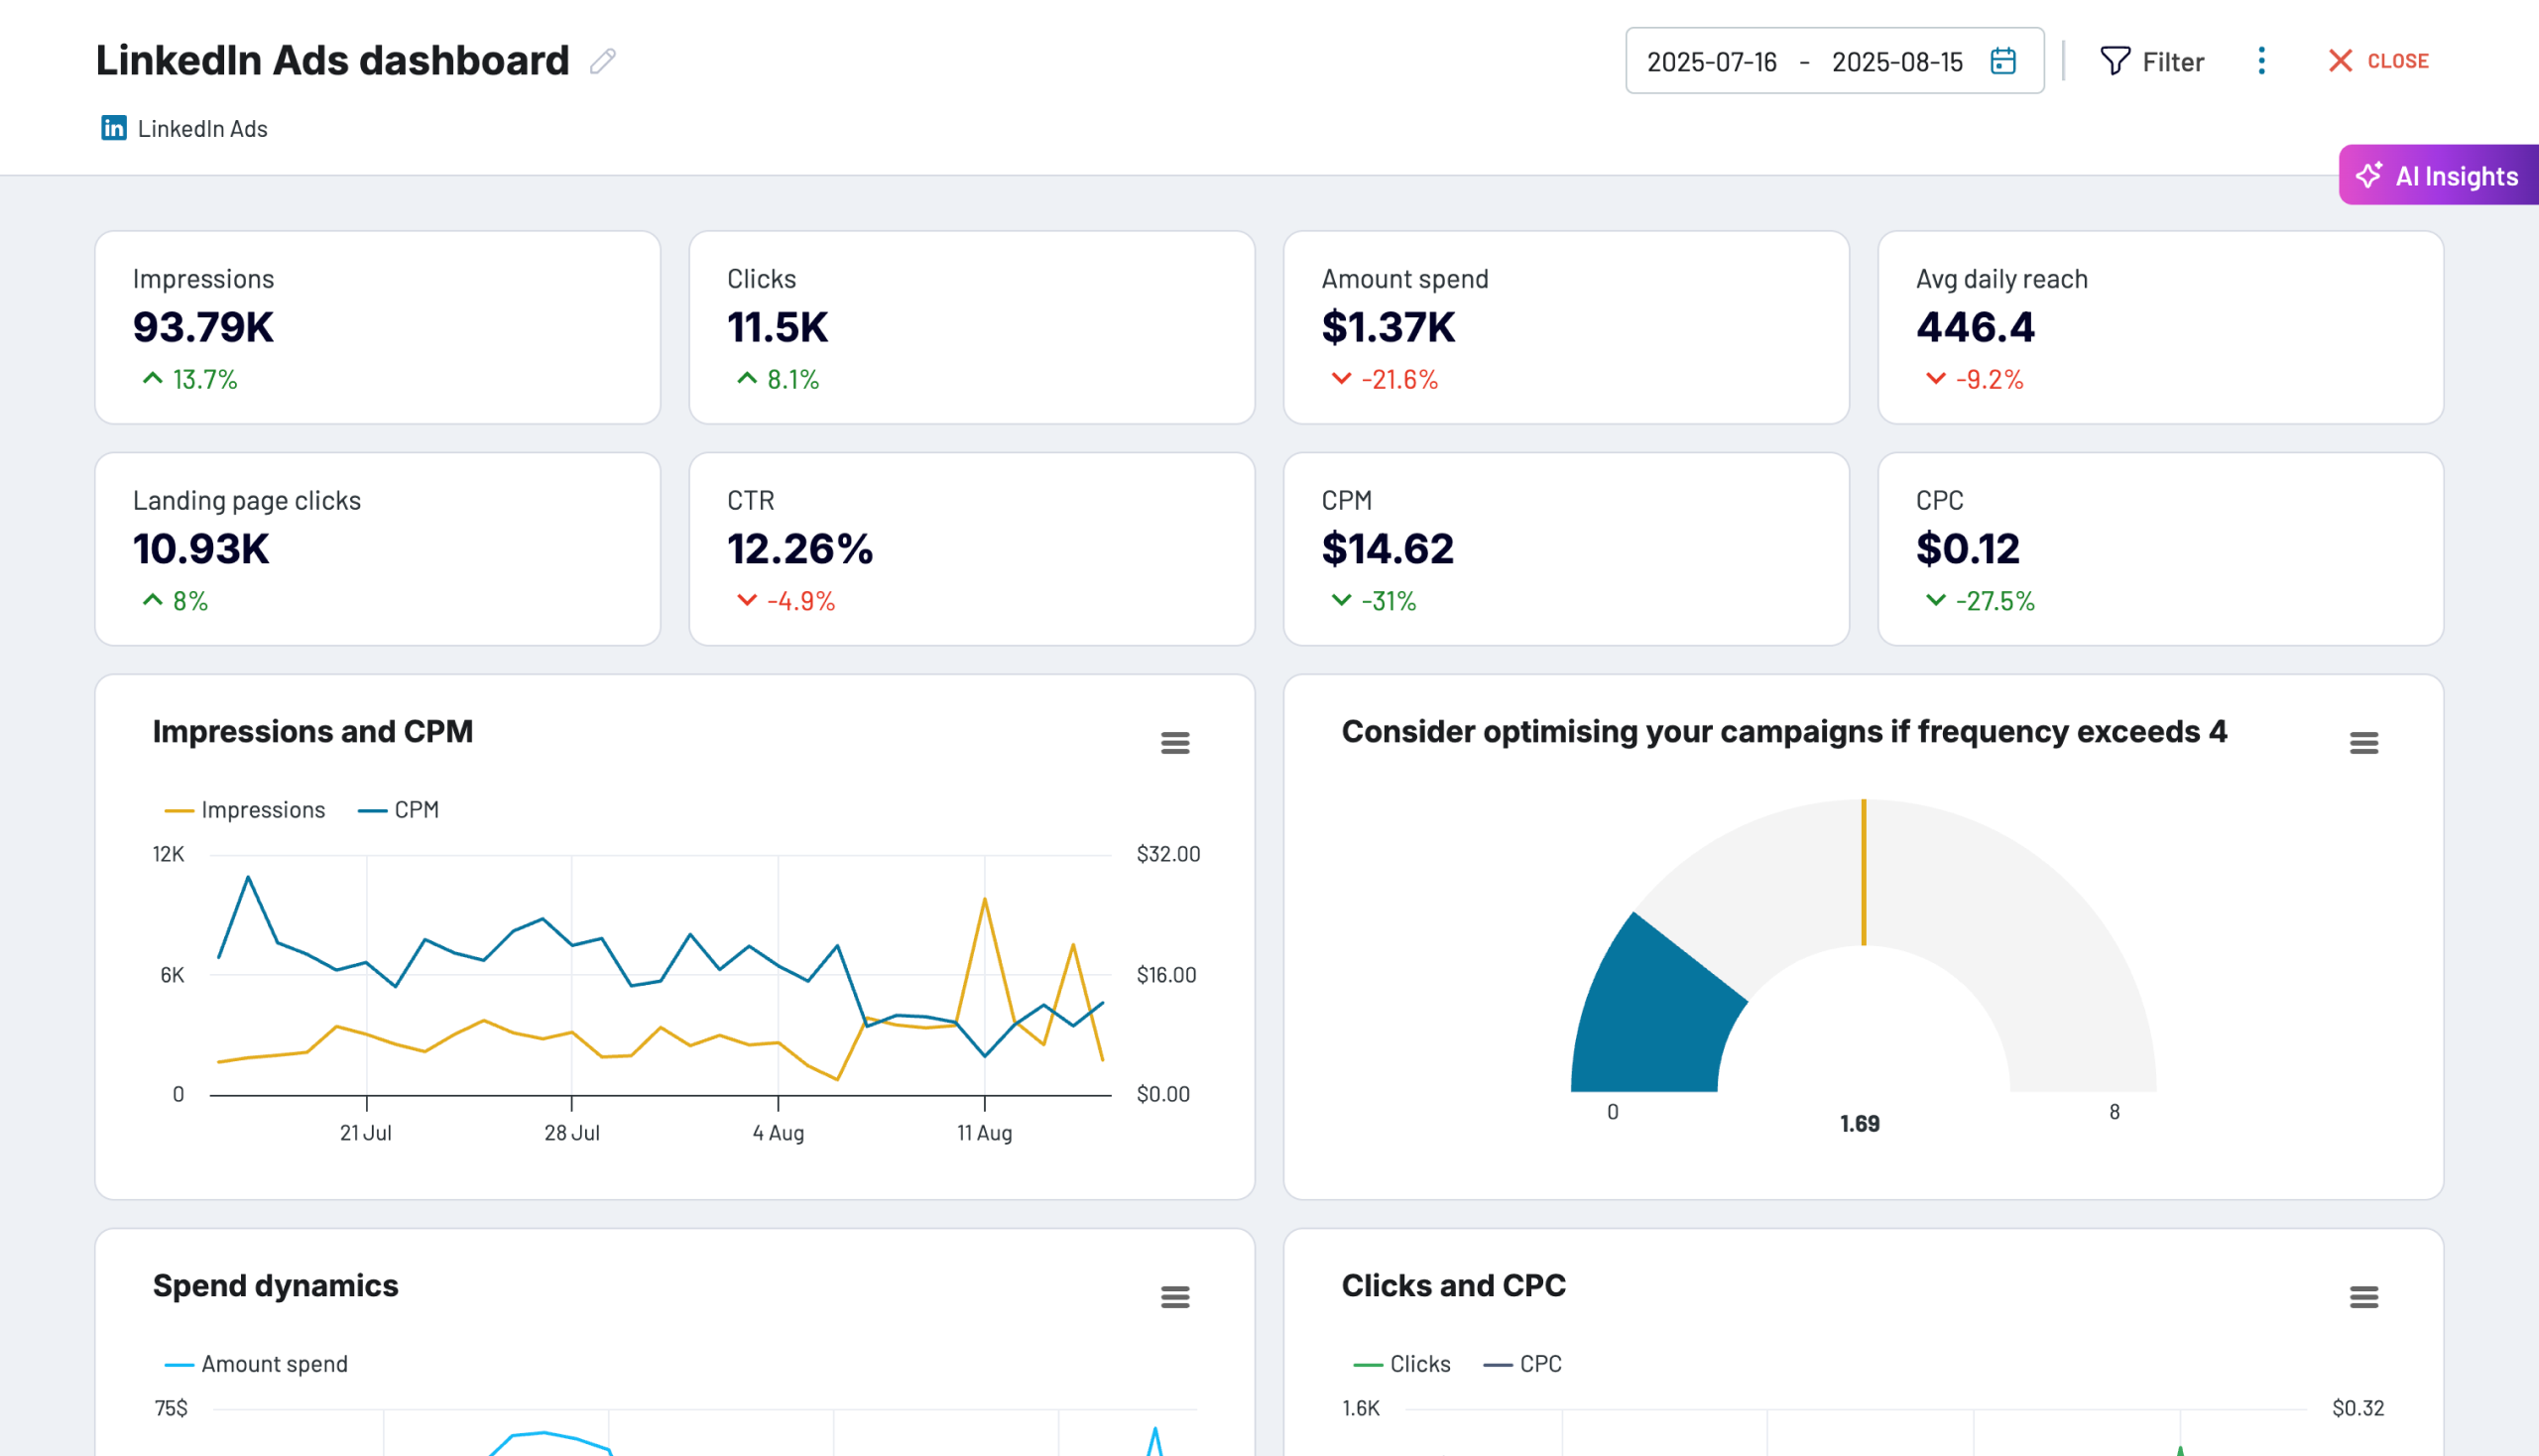
Preview on dashboardThat’s the basics – all your key metrics must be available at your fingertips. It’s handy to show their value compared to the previous period, just like in this example. The set of metrics will be different depending on your goals.
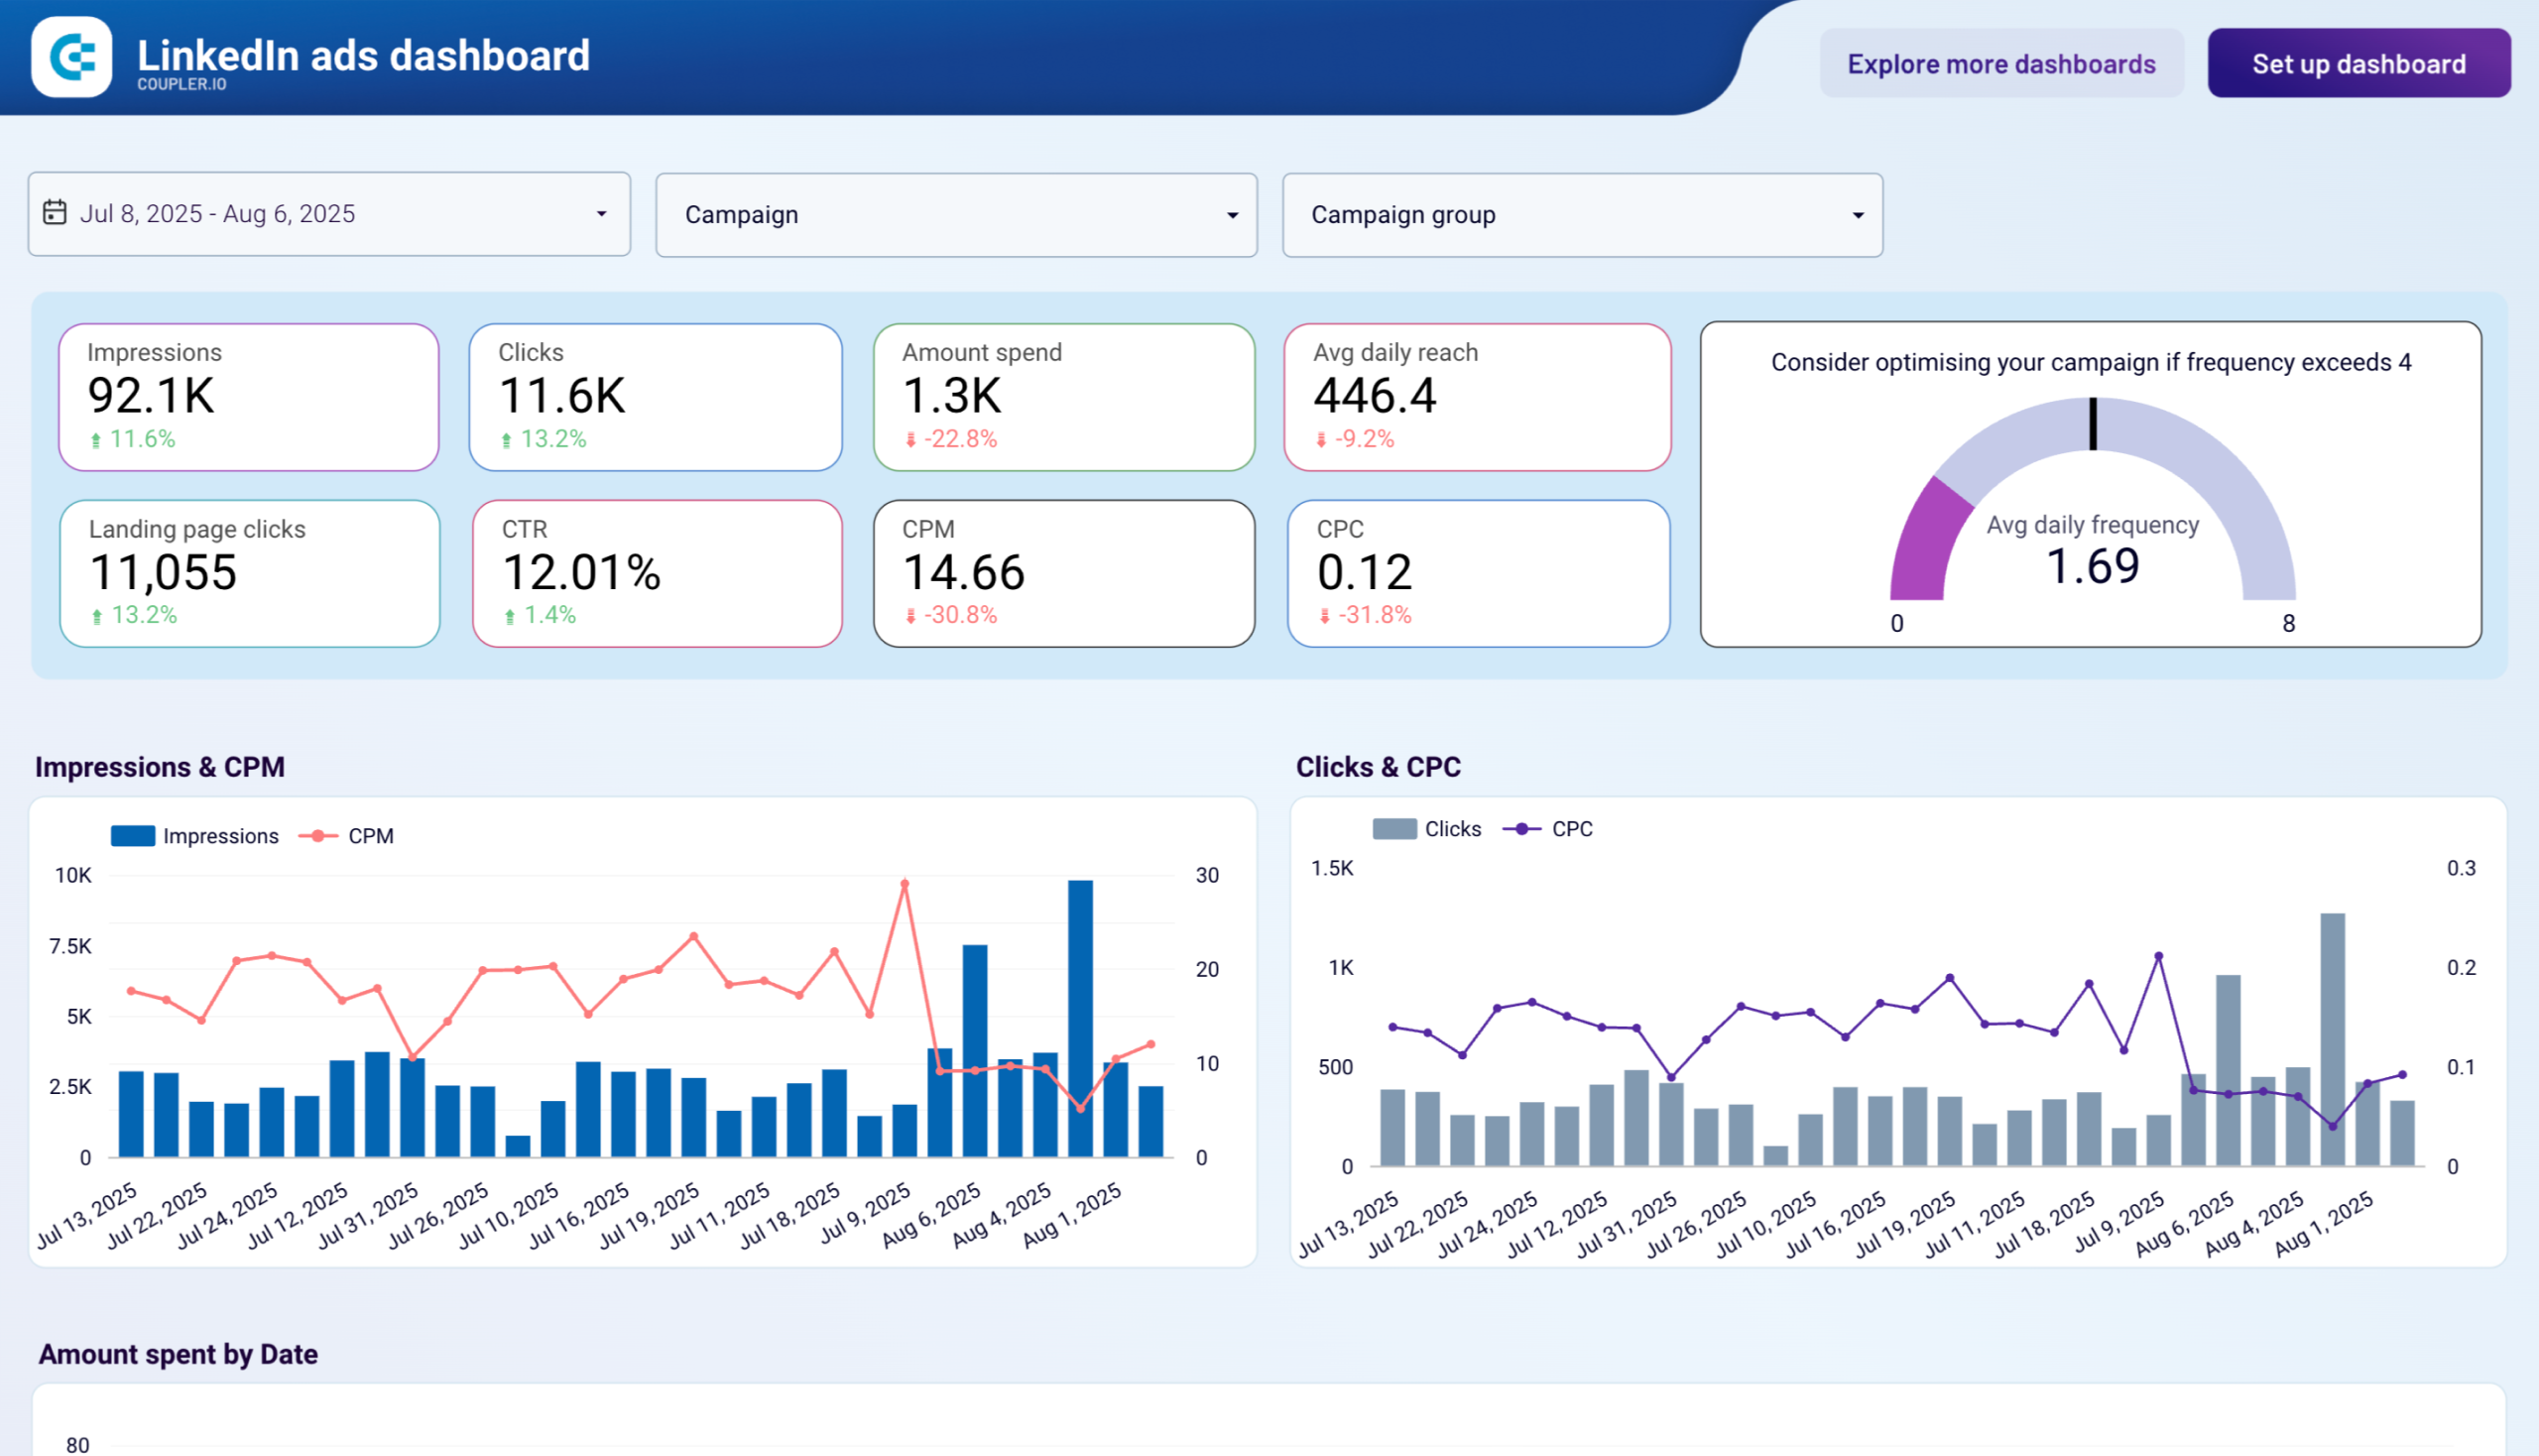
Dynamics within the selected time range
LinkedIn Ads dashboard in Coupler.io
 Preview on dashboard
LinkedIn Ads dashboard in Coupler.io
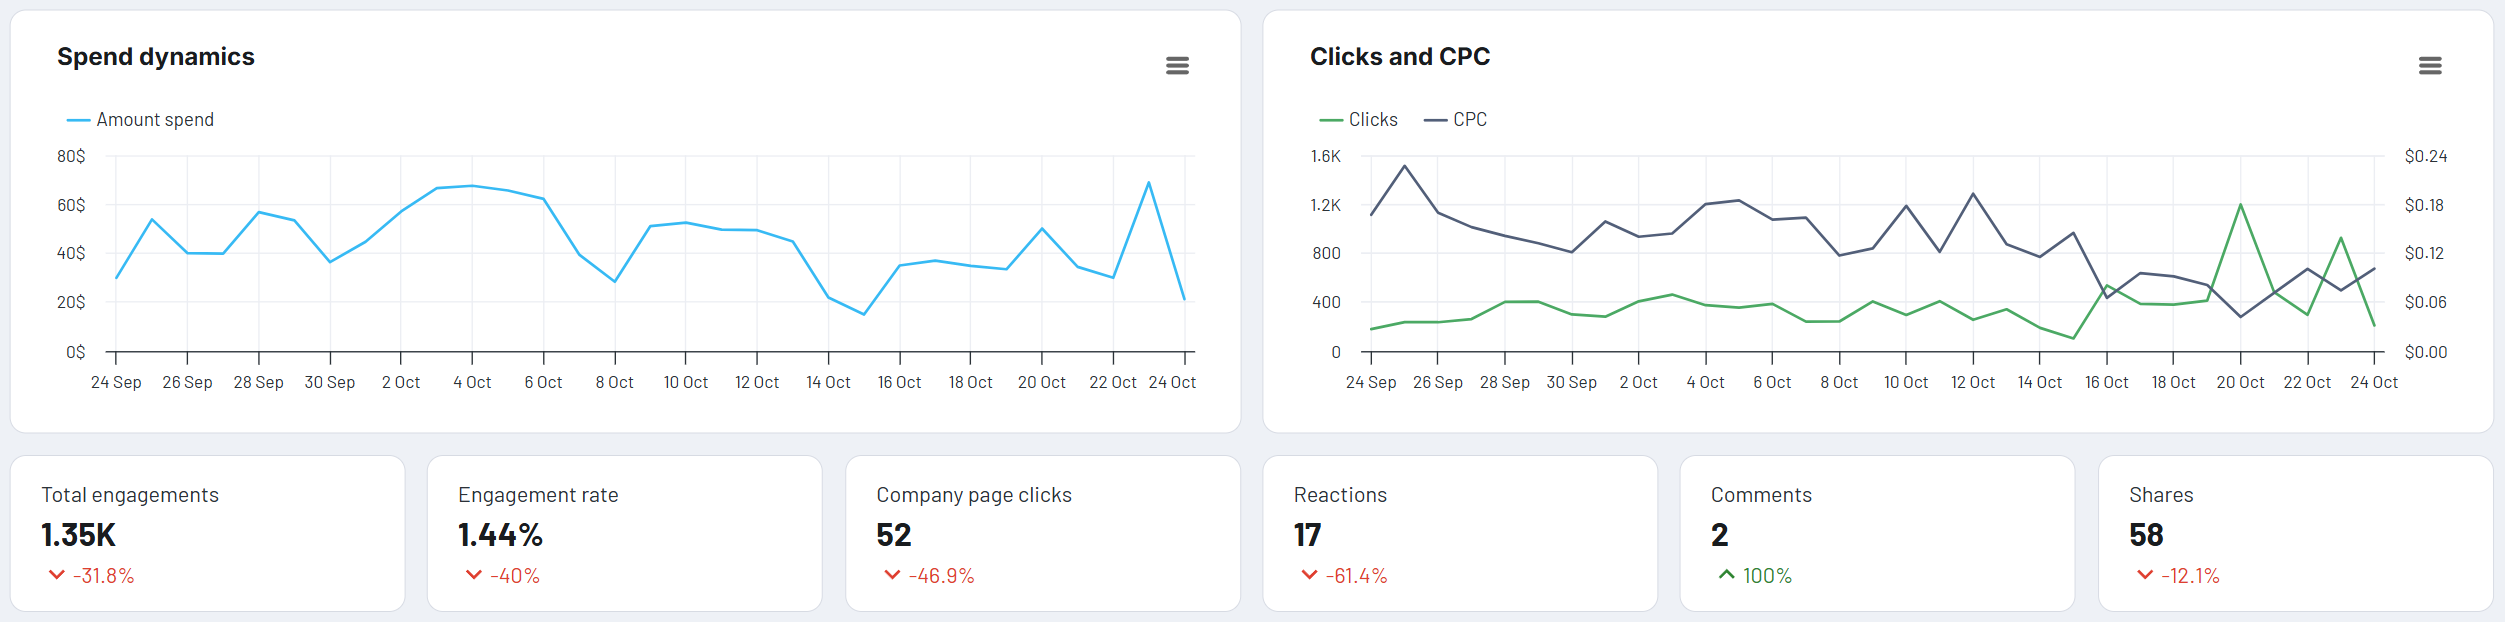
Preview on dashboardIt’s essential to track the dynamics of your key metrics. Line charts work best for this. As a result, you can identify trends and spot potential issues.
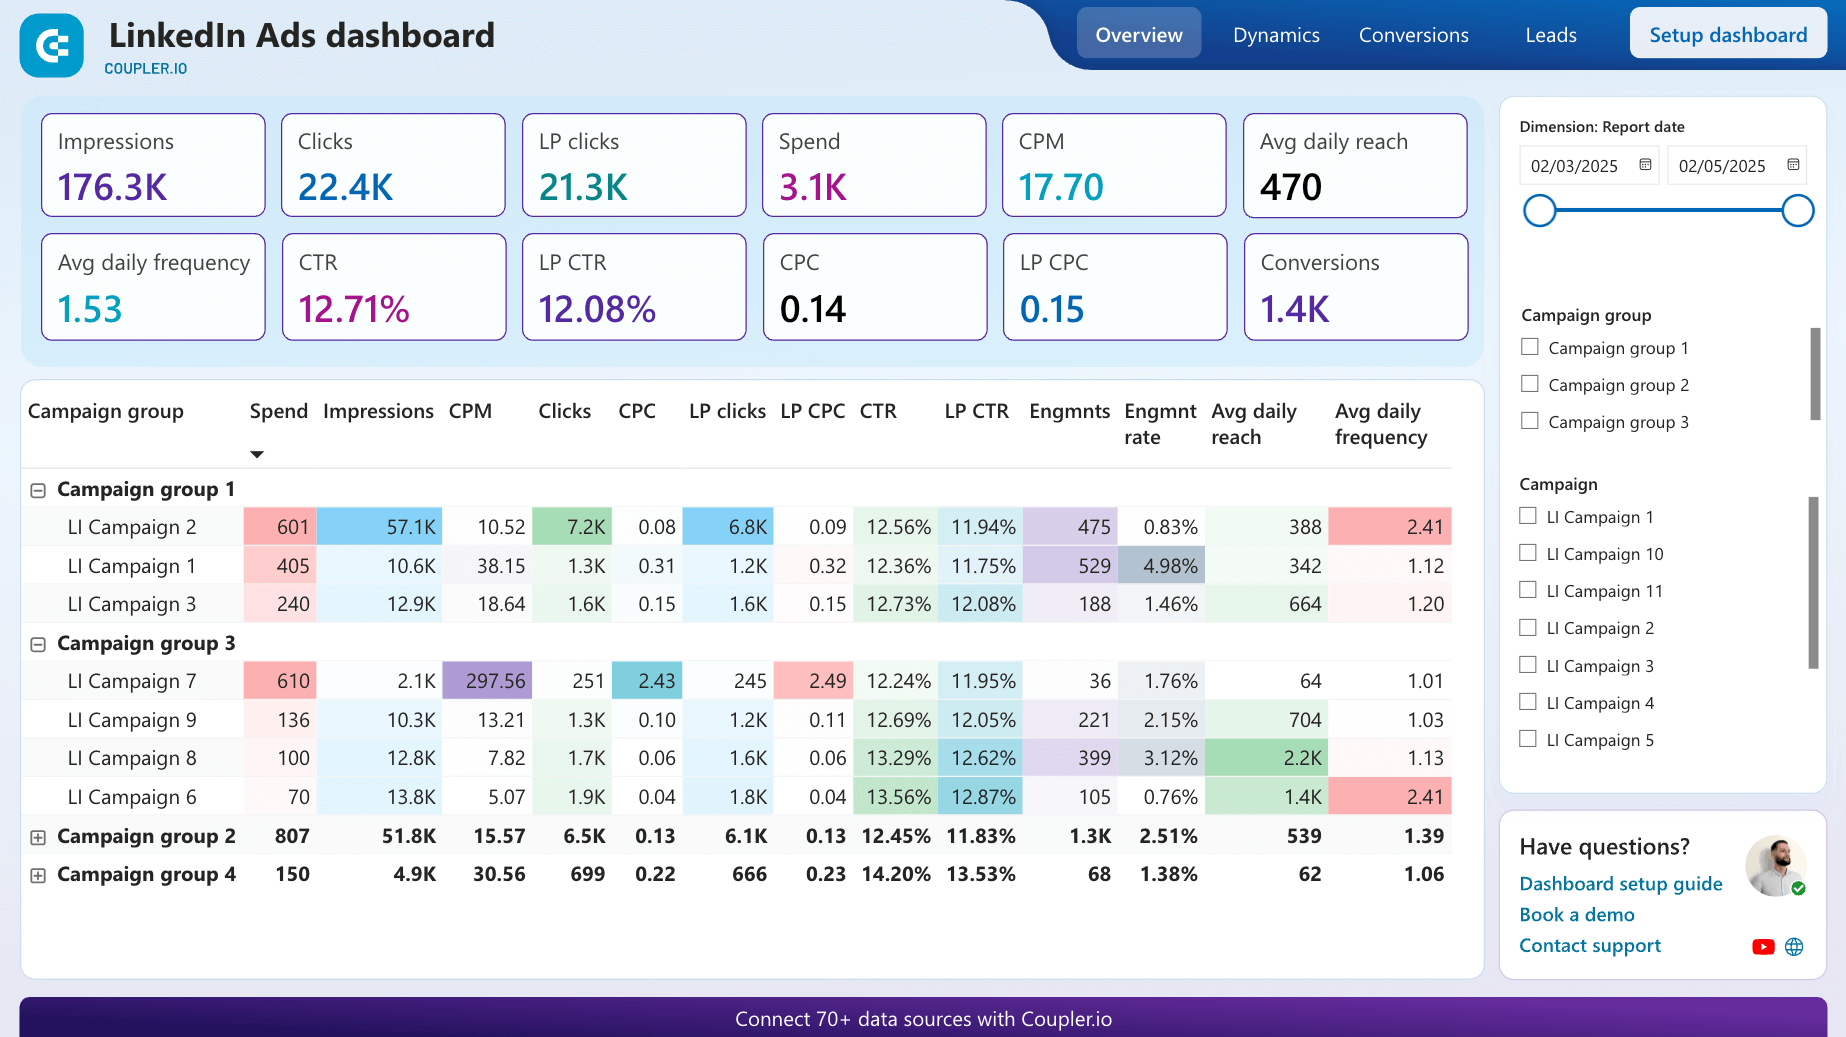
Campaign performance breakdown
LinkedIn Ads dashboard in Power BI
 Preview on dashboard
LinkedIn Ads dashboard in Power BI
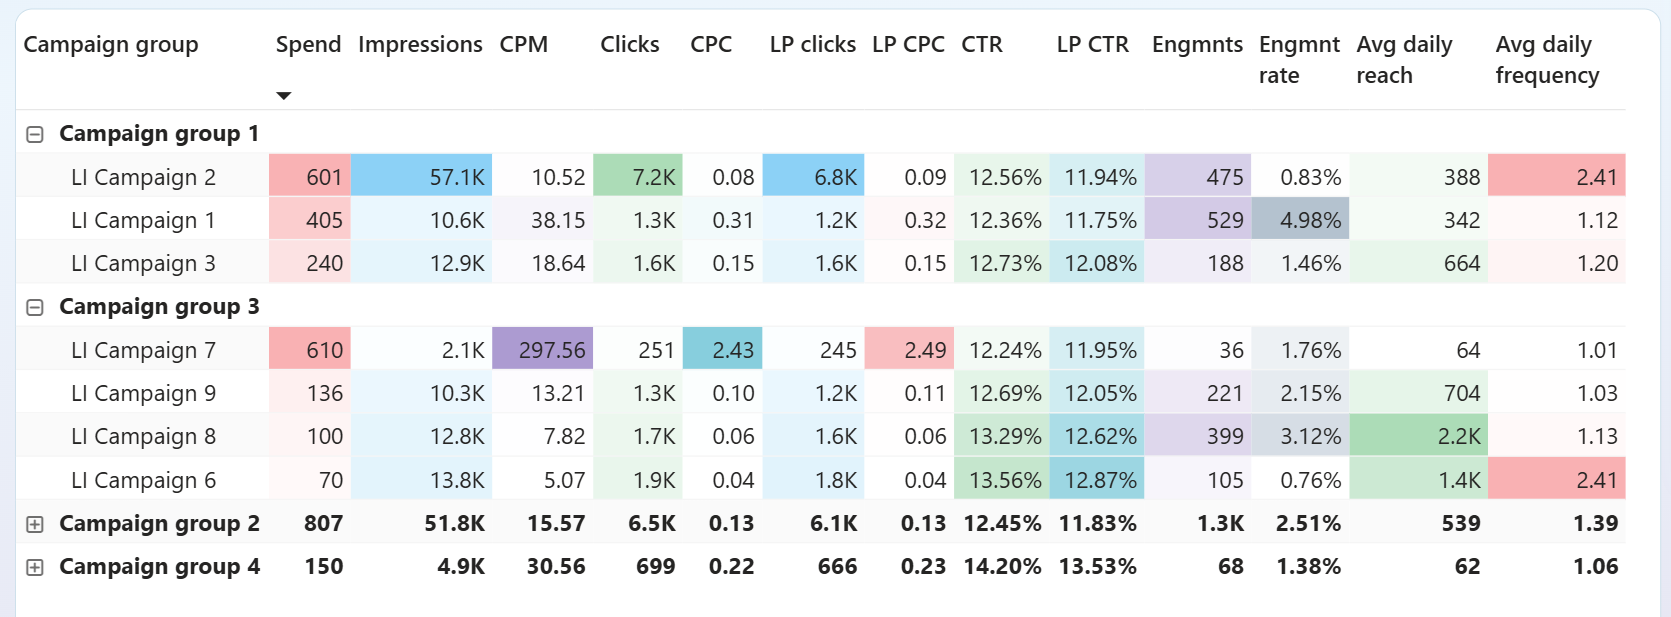
Preview on dashboardWith an overview of all your campaigns and their comparison by key performance indicators, you can efficiently distribute your effort.
Conversions and leads
LinkedIn Ads dashboard in Looker Studio
 Preview on dashboard
LinkedIn Ads dashboard in Looker Studio
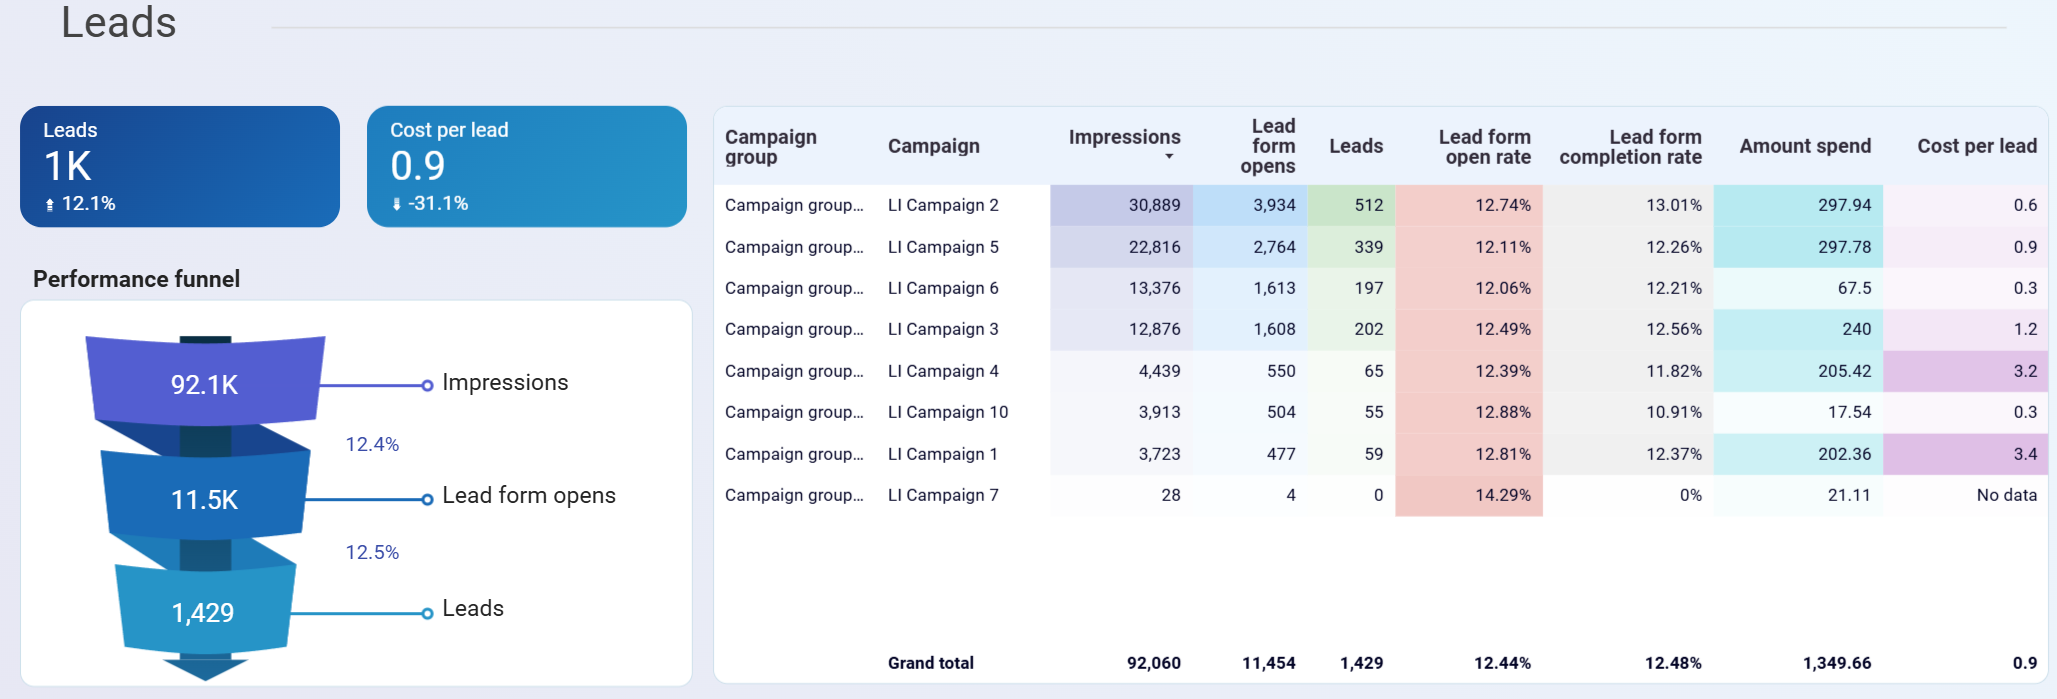
Preview on dashboardLinkedIn Ads are meant to bring impressions which, in turn, must be converted into leads. Your LinkedIn advertising dashboard should have a block dedicated to conversions so you can understand the performance of your pipeline.
How to get a custom LinkedIn Ads performance dashboard
There are three ways to get your own custom dashboard:
- Use a white-label dashboard template
- Create a dashboard yourself
- Hire a professional or service to do the job
Use a white-label dashboard template
LinkedIn Ads report template is a ready-to-use solution with preset reports and metrics. You only need to load your LinkedIn Ads data to get the dashboard up and running. This can be done either manually, which is quite inefficient, or automatically if the dashboard is equipped with a connector to LinkedIn Ads.
Create a dashboard yourself
Building your custom dashboard is a more cost-effective option if you know what you’re doing. It will also give you more flexibility in terms of customization and design. You need to choose a tool for your dashboard, design it there, and populate it with the data. Although you have control over the process, things can get tricky if you don’t know how to build the dashboard properly.
Hire a professional or service to do the job
Since building a quality custom dashboard requires a deep knowledge of data analysis, sometimes it’s better to outsource this job to experts. This way, you will have a custom dashboard that will be set up in no time and is built specifically to cater to your business’s needs.
Examples of LinkedIn Ads performance dashboard templates
We’ve collected a few examples of white-label dashboard templates that will help you evaluate LinkedIn Ads’ performance. All the templates are equipped with Coupler.io connectors to integrate your LinkedIn Ads data with the dashboard easily. All you need to do is create a Coupler.io account for free and follow the instructions to set up the chosen dashboard. The process takes up to 5 minutes. After that, you have a fully functional reporting solution for performance analysis.
Linkedin Ads dashboard
This is a dashboard template to overview the performance of ad campaigns on LinkedIn.
The dashboard consists of two pages:
- On the first page, you will find an overview of key metrics and their dynamics and a campaign performance breakdown.
- The second page is dedicated to conversion metrics and leads. Here, you can find insights into how efficient your conversions are and what campaigns have the lowest cost per lead.
The template is available for free in Looker Studio, Power BI, and Google Sheets. Choose the version you prefer and connect it to your LinkedIn Ads account.


LinkedIn Ads leads dashboard
This specialized dashboard template is designed specifically for businesses where lead generation is the primary campaign objective. It focuses on lead acquisition metrics, conversion tracking, and cost per lead optimization.
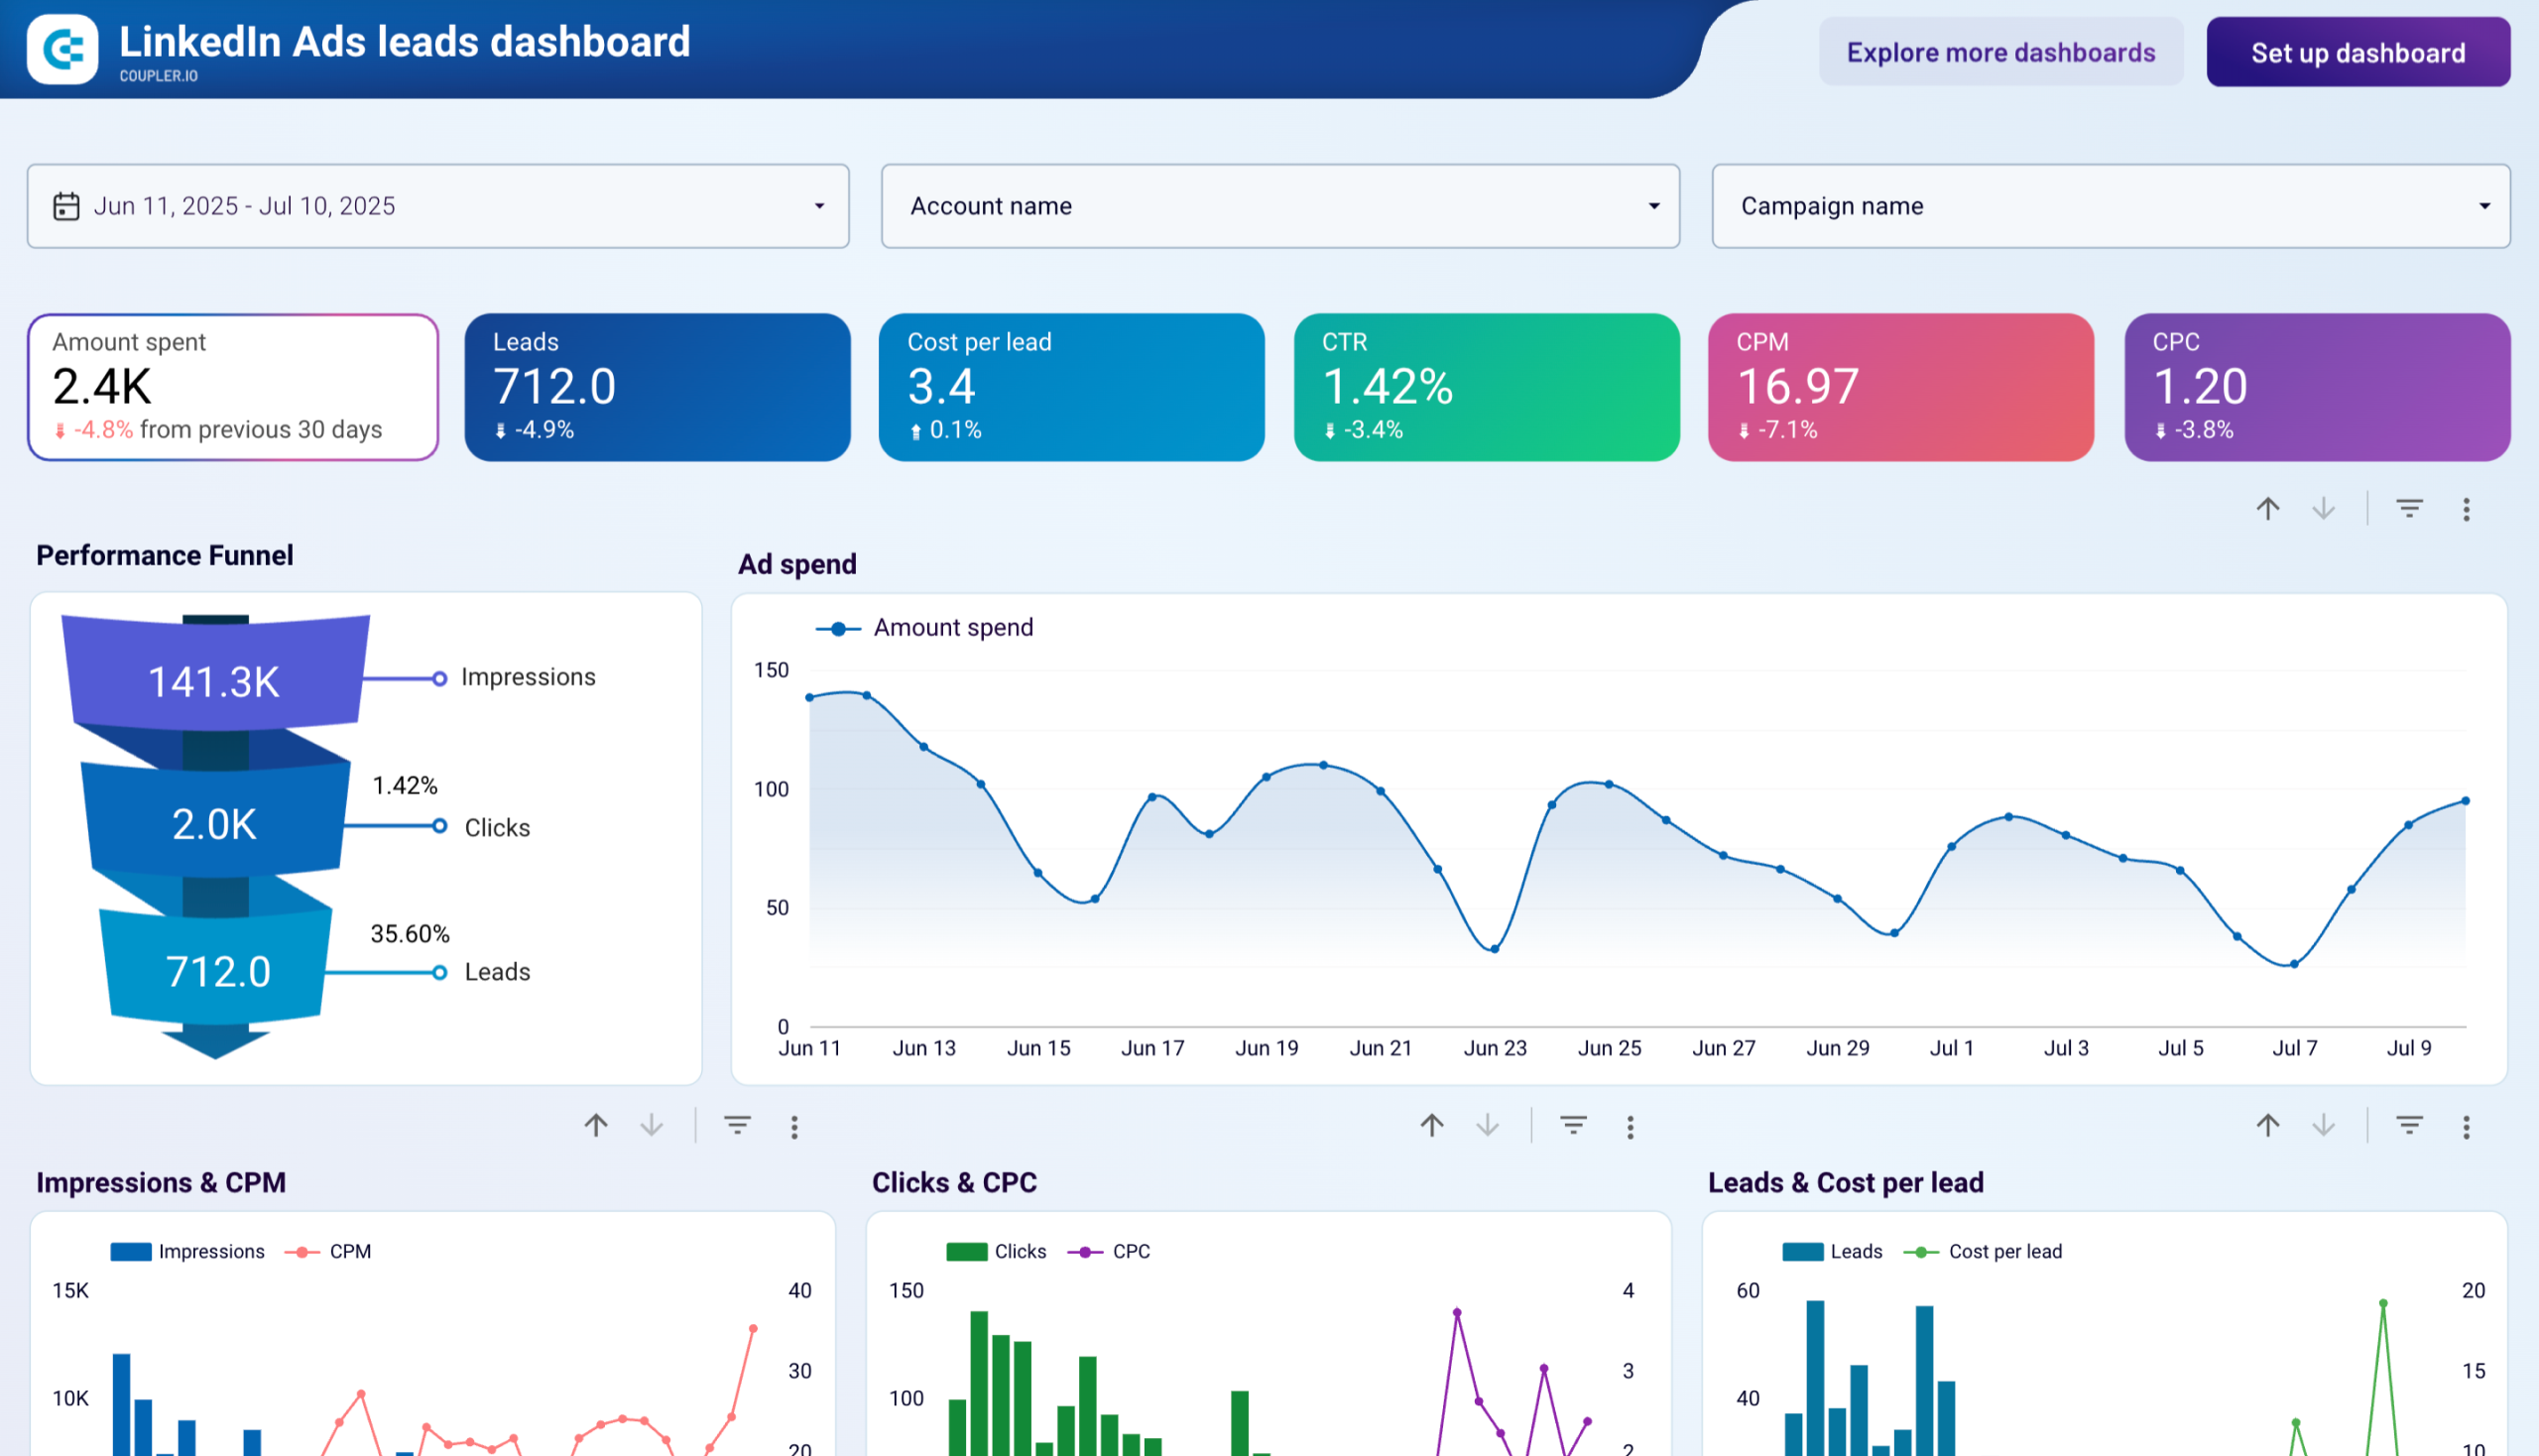
What insights the dashboard provides:
- Lead generation funnel analysis showing the complete conversion path from impressions through clicks to qualified leads with conversion rates at each stage.
- Cost per lead tracking and optimization with historical trending data to identify the most cost-effective campaigns and targeting strategies.
- Campaign comparison for lead generation with detailed breakdowns to identify which campaigns, audiences, and creative approaches deliver the highest quality leads.
The LinkedIn Ads leads dashboard is available as a Looker Studio template and powered by Coupler.io’s automated data connector. The setup process involves connecting your LinkedIn Ads account to pull lead-focused performance data and populating the dashboard with real-time metrics.
LinkedIn Ads creatives dashboard
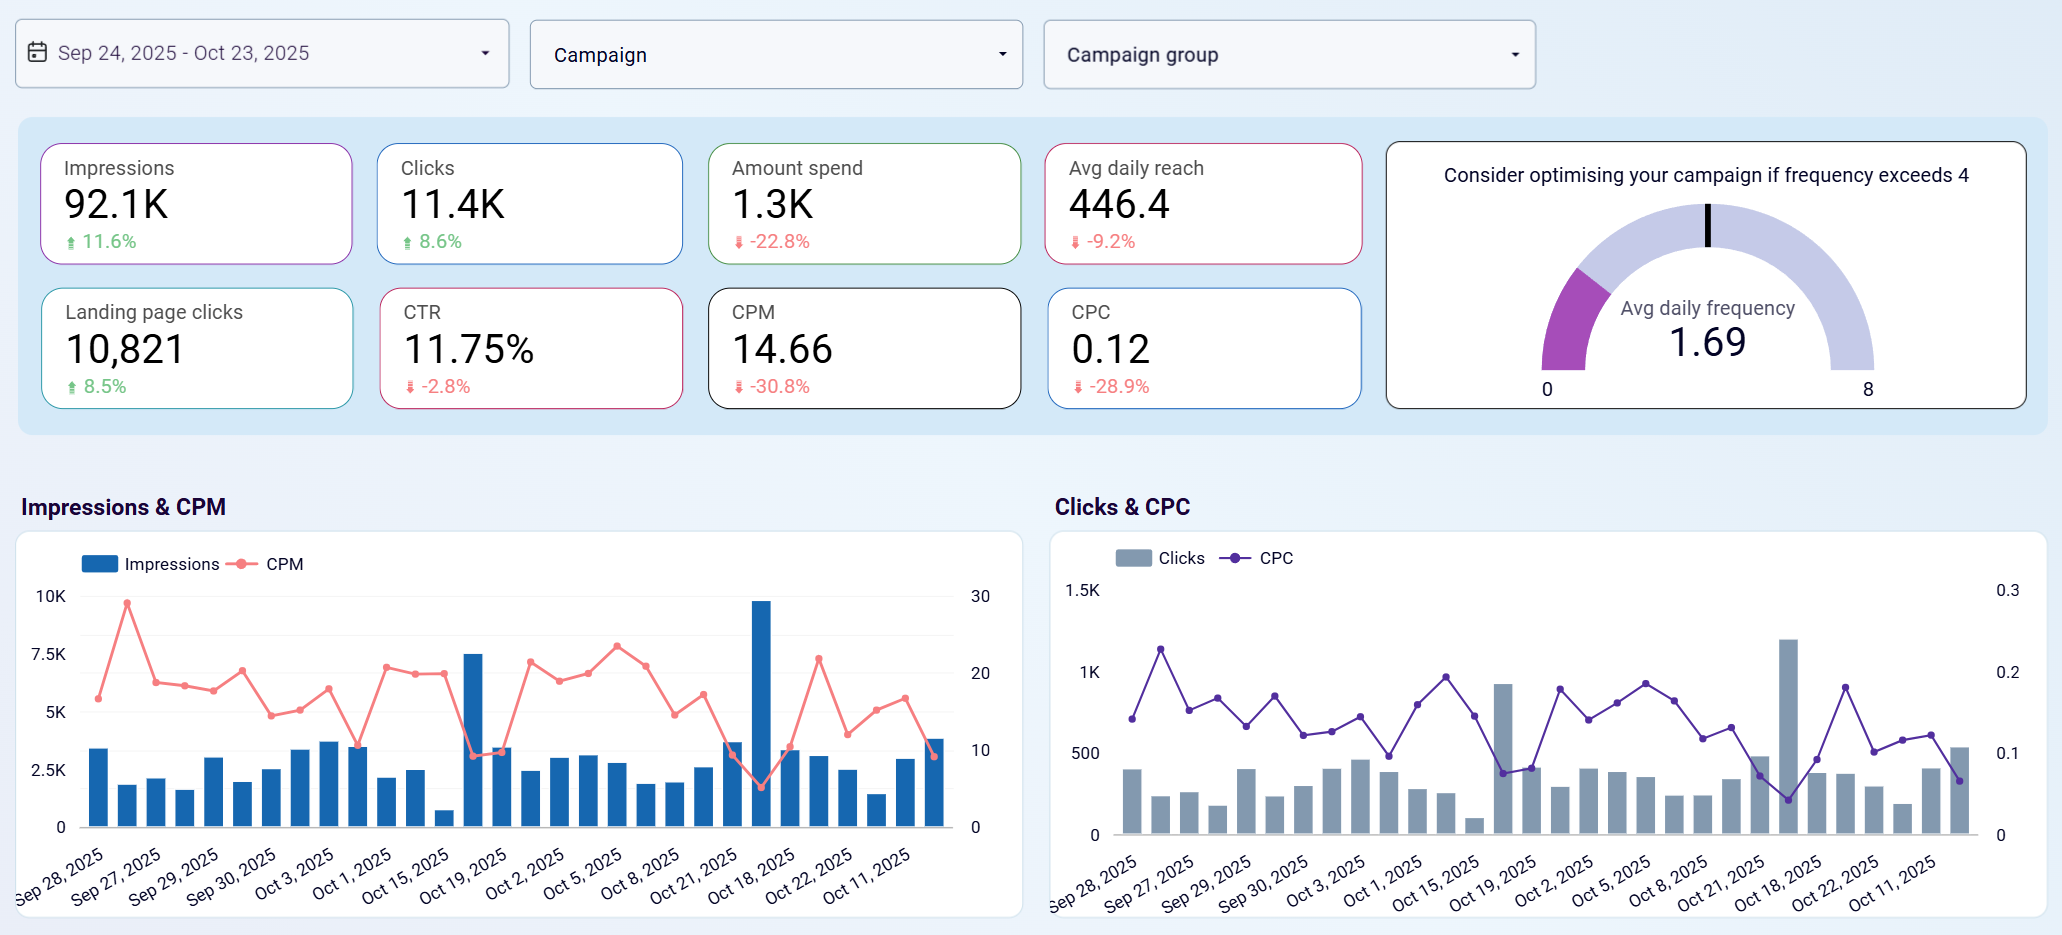
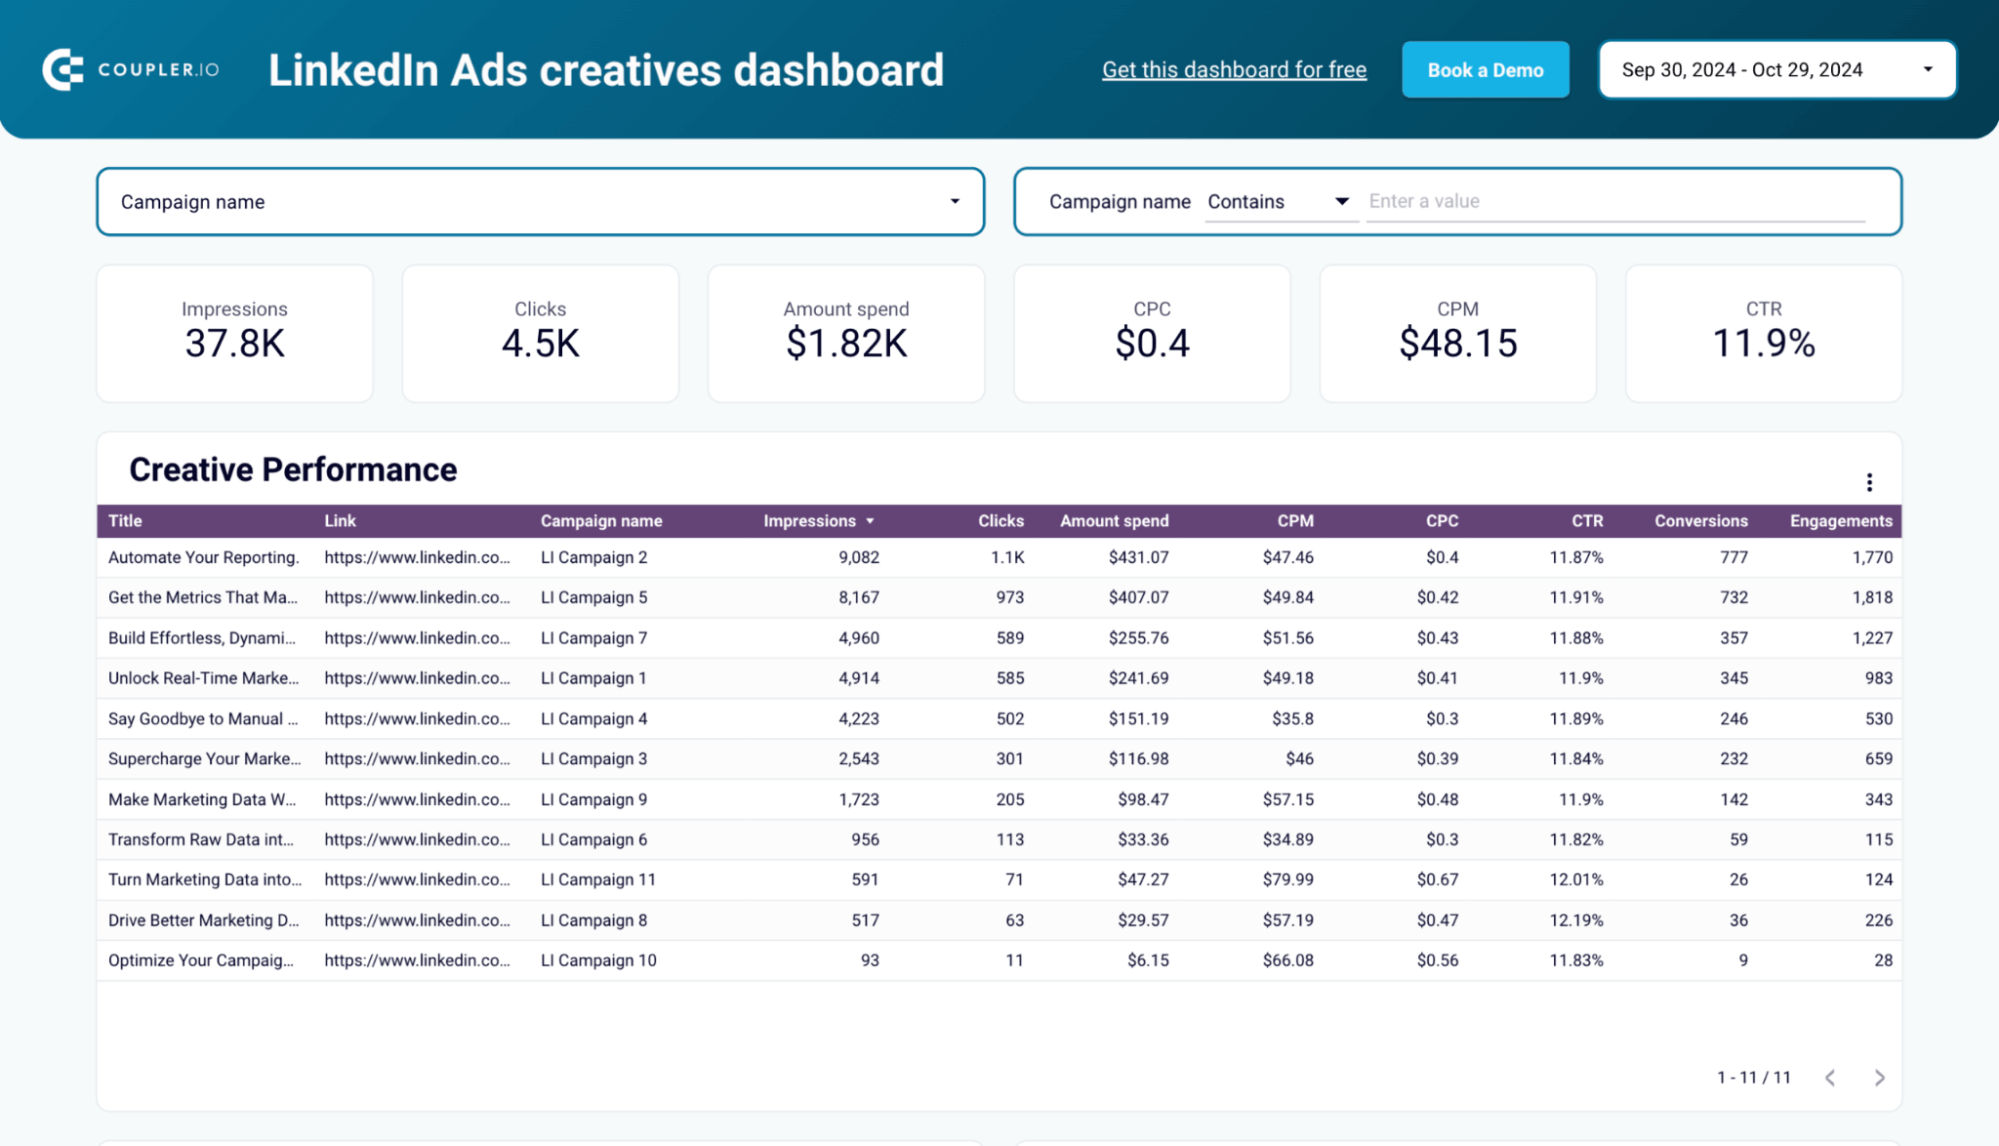
This dashboard template gives a performance overview of all the creatives used in LinkedIn Ads over a period of time.
LinkedIn Ads creatives dashboard
 Preview dashboard
LinkedIn Ads creatives dashboard
Preview dashboardYou can also filter them by campaign name. It gives a quick glance at the key metrics – impressions, clicks, CPC, CPM, CTR, and engagements.
Let’s take a look at each visual in detail:
- Creative Performance: This table provides a detailed breakdown of your creatives by metrics such as engagements, CTR, CPM, CPC, conversions, and total spend. You can sort the data by impressions, see how each creative is performing, compare, and prioritize accordingly.
- Comparison line charts: You’ll see two line charts: Impressions vs. CPM and Clicks vs. CPC. Both will show how the change in impressions and clicks is impacting the cost. With insights from these line charts, you can optimize bidding strategy, refresh ad creatives, and adjust audience targeting.
- Spend dynamics chart: This line chart shows spending trends and budget pacing, helping you control costs and optimize ROI.
The LinkedIn Ads creatives dashboard is built by Coupler.io in Looker Studio. To customize it with your own data, follow the instructions in the Readme tab. The template has a built-in connector that updates data automatically.
Read more on how to track performance of ad creatives.
LinkedIn page and ads analytics dashboard
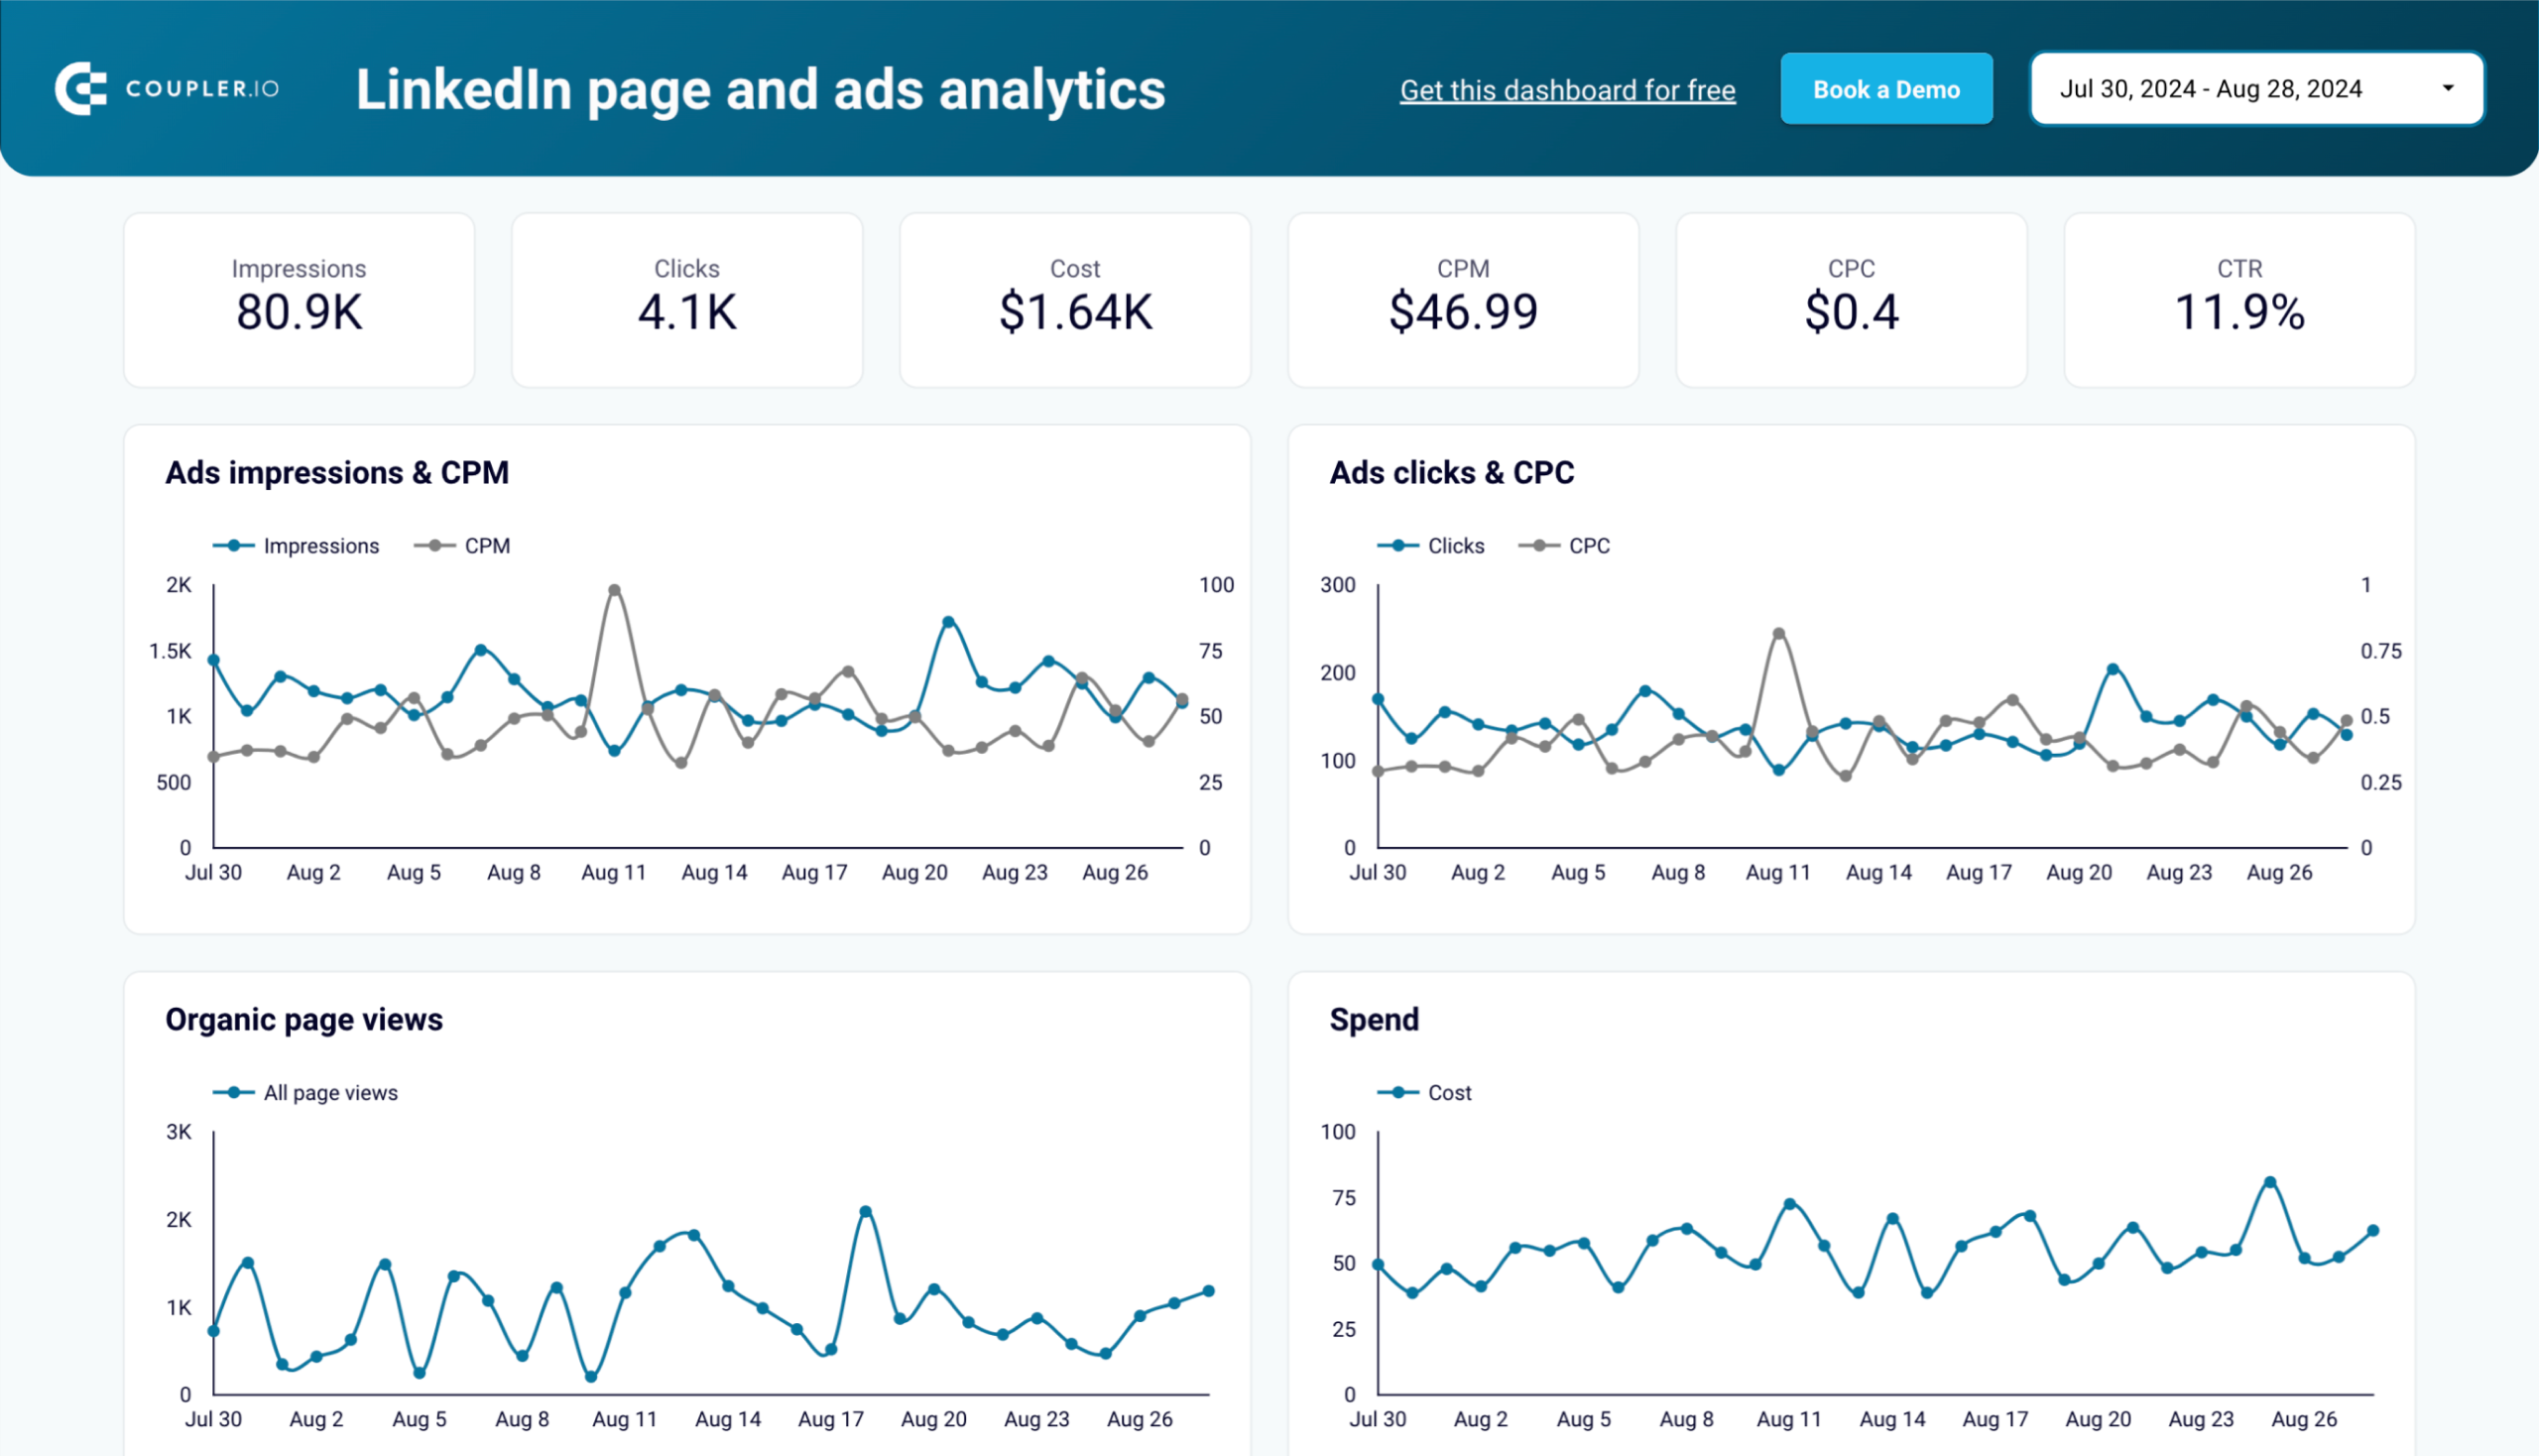
If you want to analyze both organic and paid performance on LinkedIn, this dashboard template is for you. It combines insights from LinkedIn Ads and LinkedIn Company Pages giving you a holistic view.
LinkedIn page and ads analytics dashboard
 Preview dashboard
LinkedIn page and ads analytics dashboard
Preview dashboardYou can understand the effectiveness of your content, campaigns, and overall engagement strategy. This helps you monitor audience engagement and identify anomalies in clicks and CPC.
The dashboard includes:
- Comparison line charts: Similar to the LinkedIn Ads creatives dashboard, this template also has comparison line charts for ad impressions & CPM, and Clicks & CPC. It allows you to track ad reach, cost efficiency, audience engagement, and detect anomalies over time.
- Geographic insights: You can see where your ads and pages are being viewed most with a geographic breakdown of impressions and page views. This will help you understand your global audience better.
- Post Performance table: It gives a detailed view of how individual posts perform based on metrics like impressions, likes, comments, and reposts, making it easy to identify top-performing content.
This Looker Studio dashboard template comes with a built-in connector. Simply follow the setup instructions in the Readme tab to visualize LinkedIn insights of your own data.
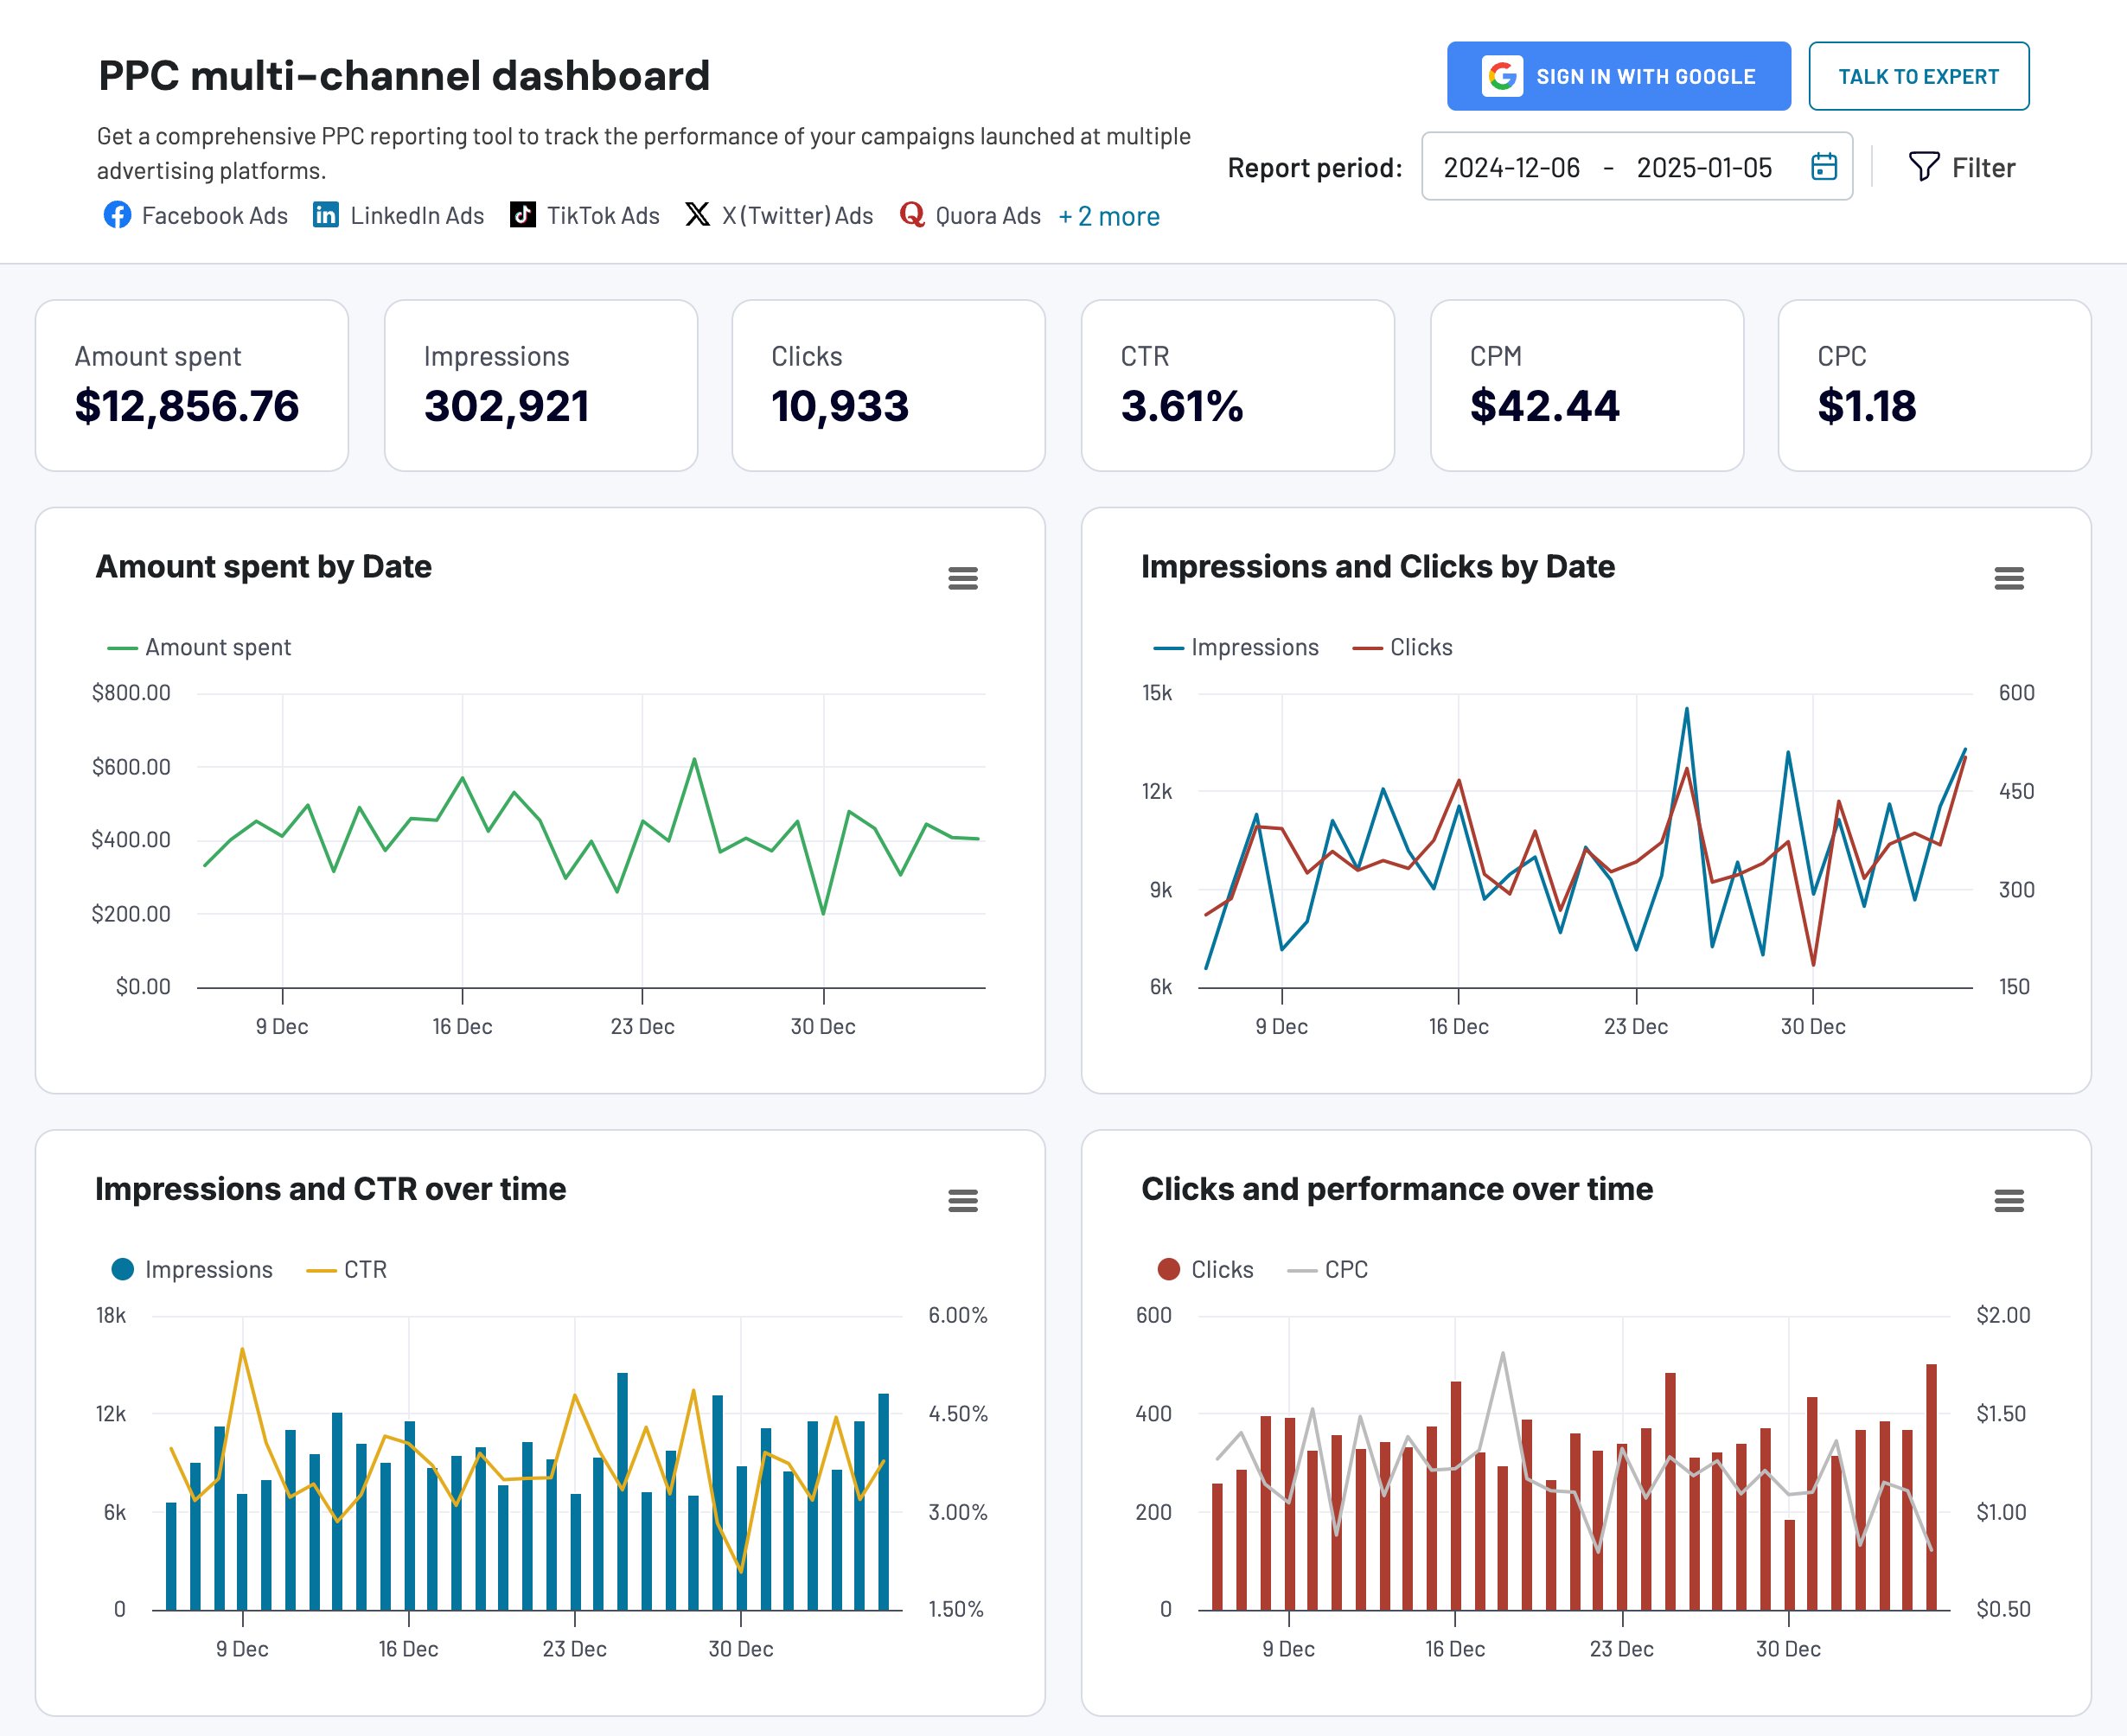
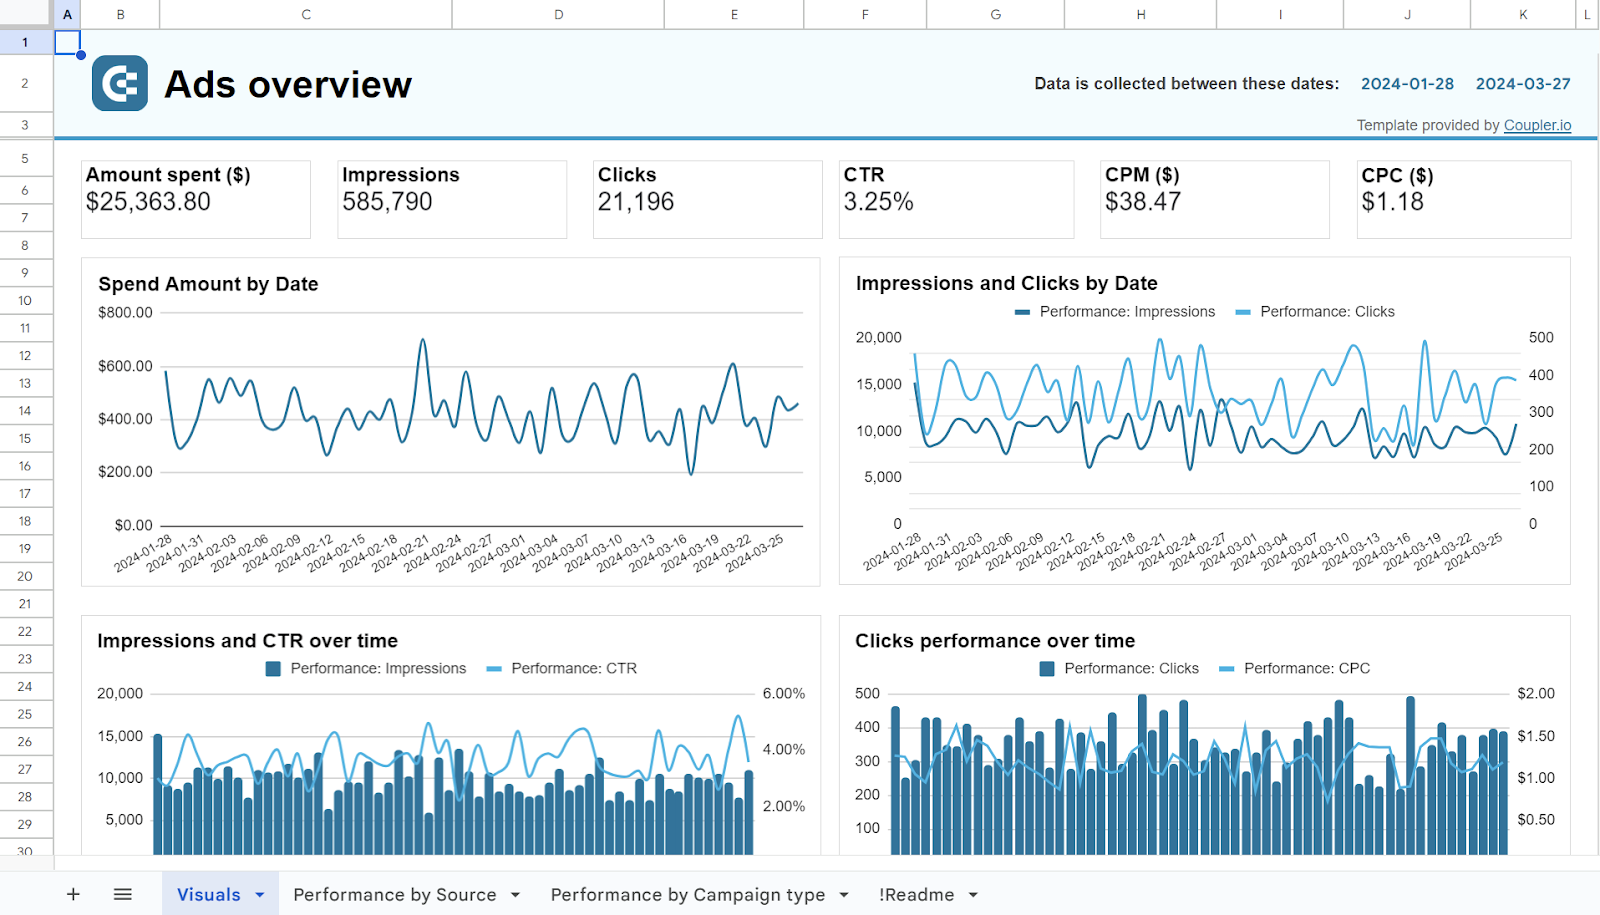
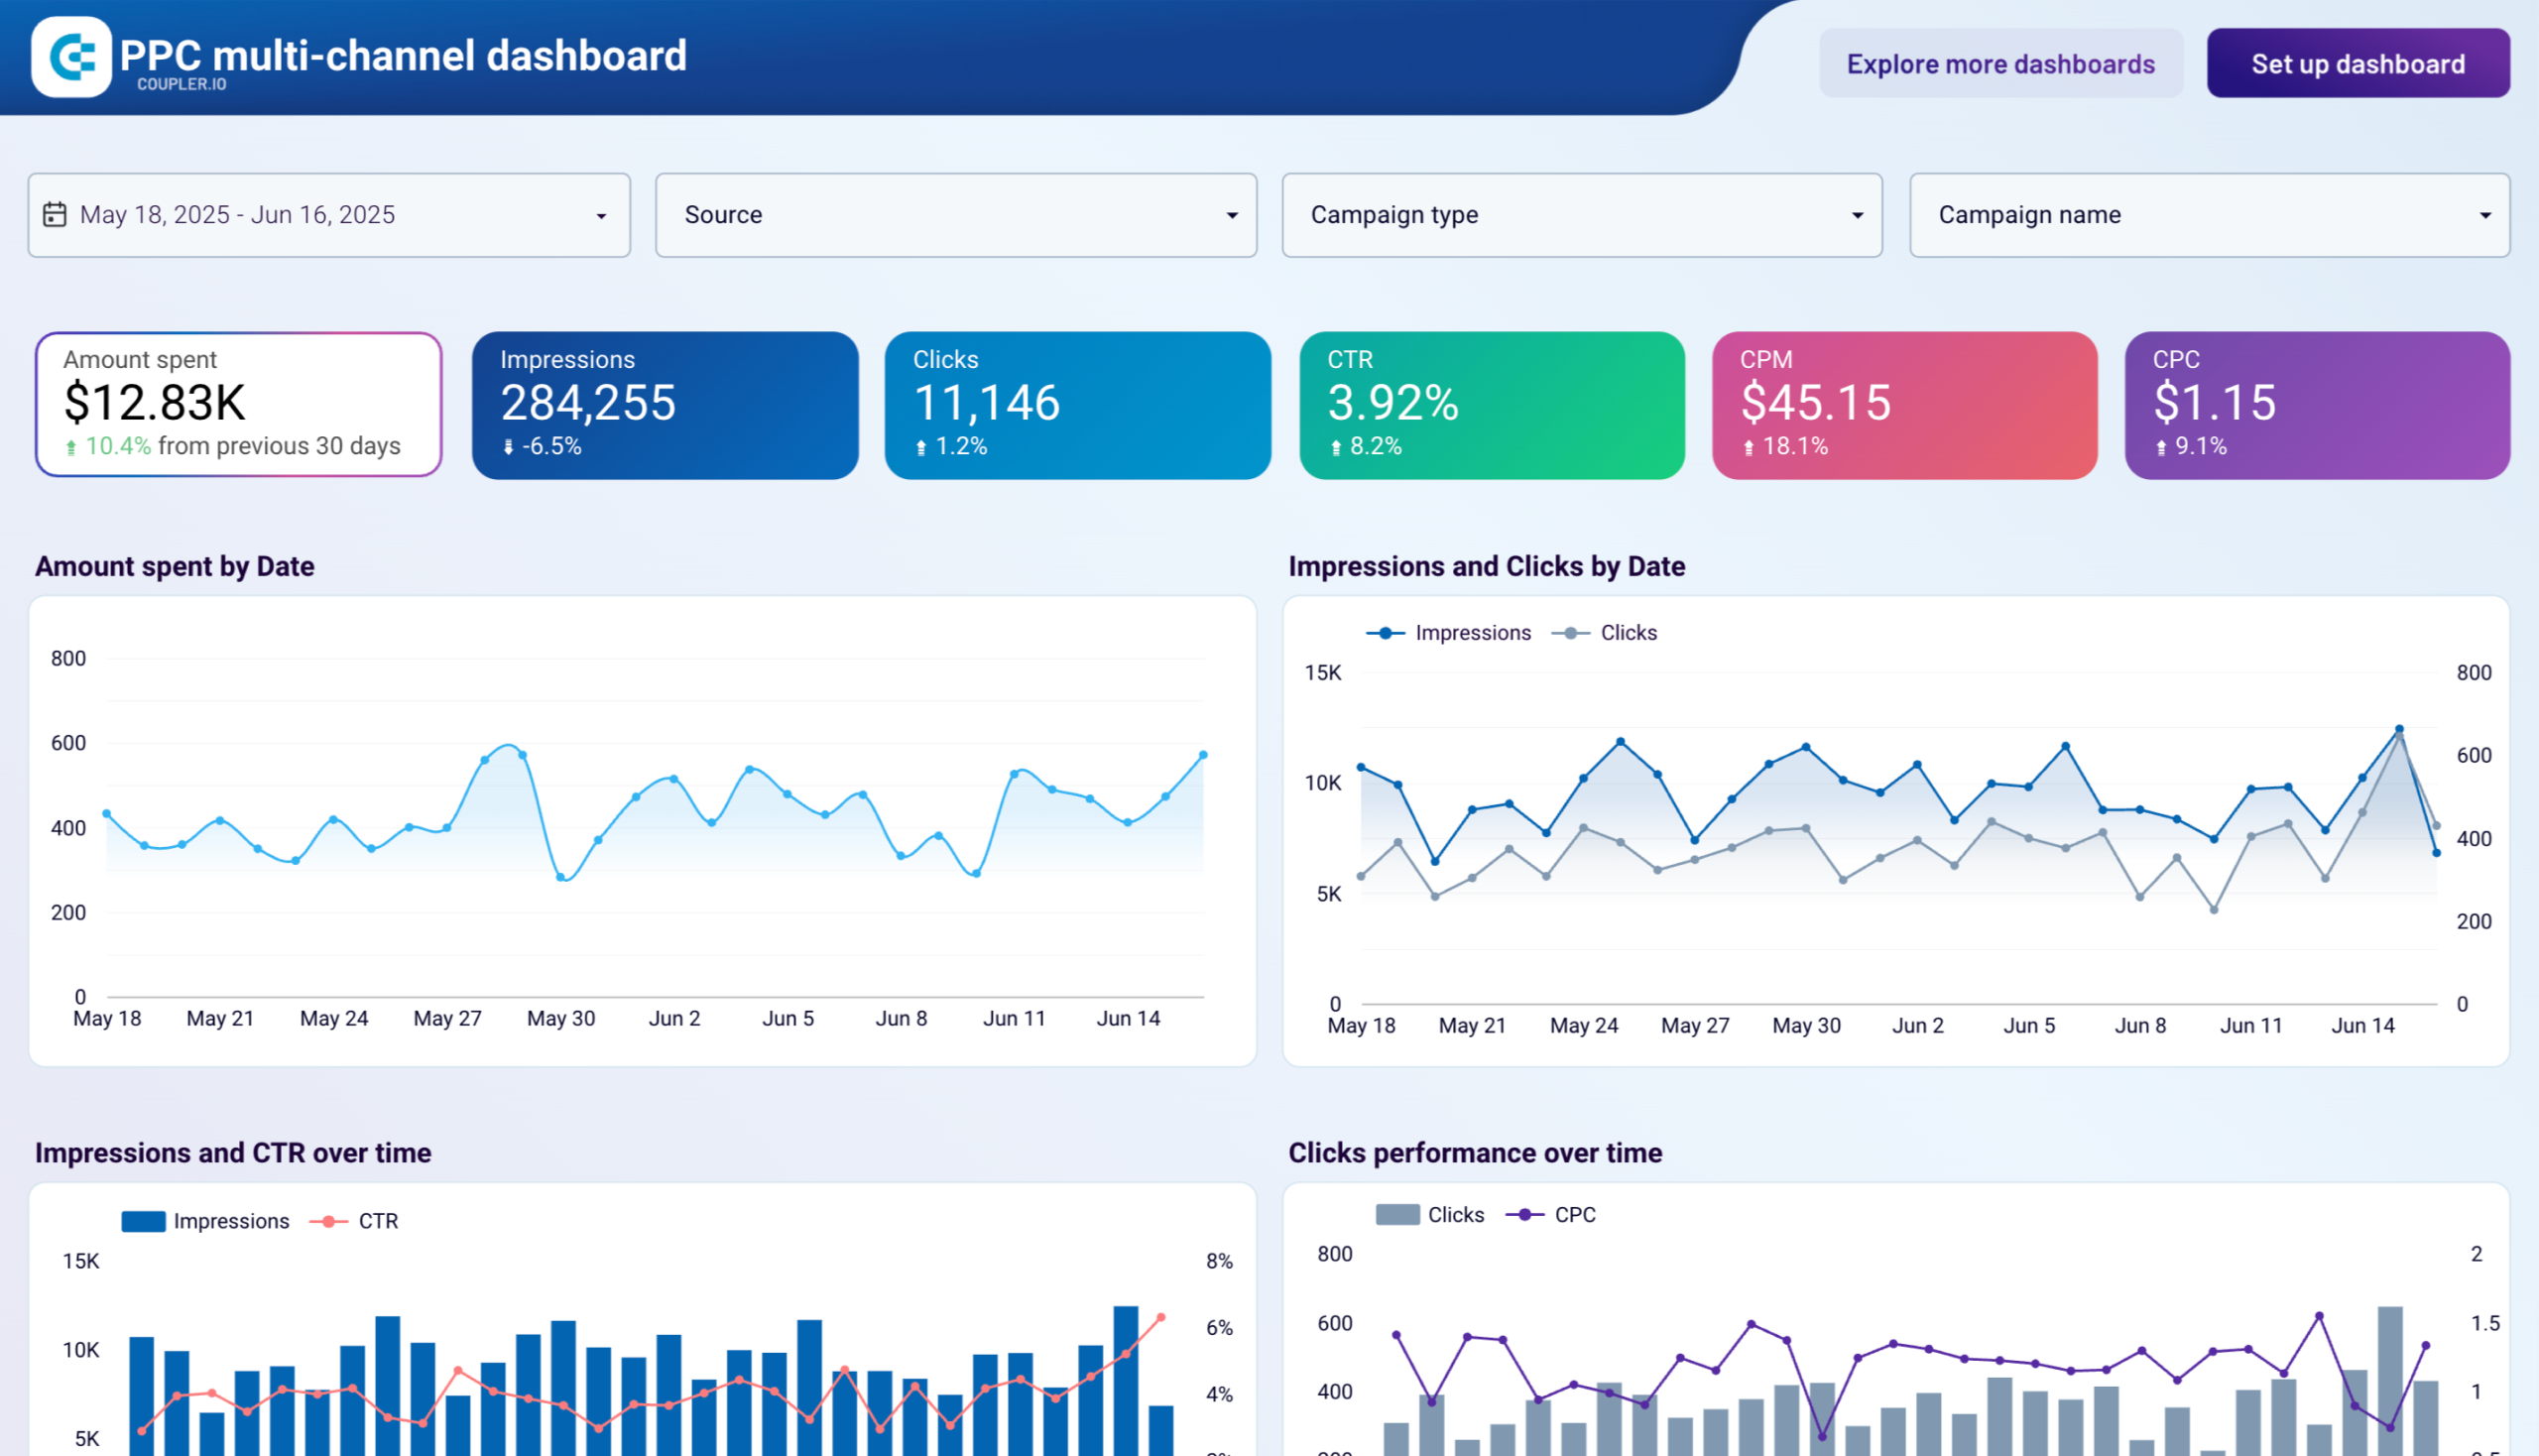
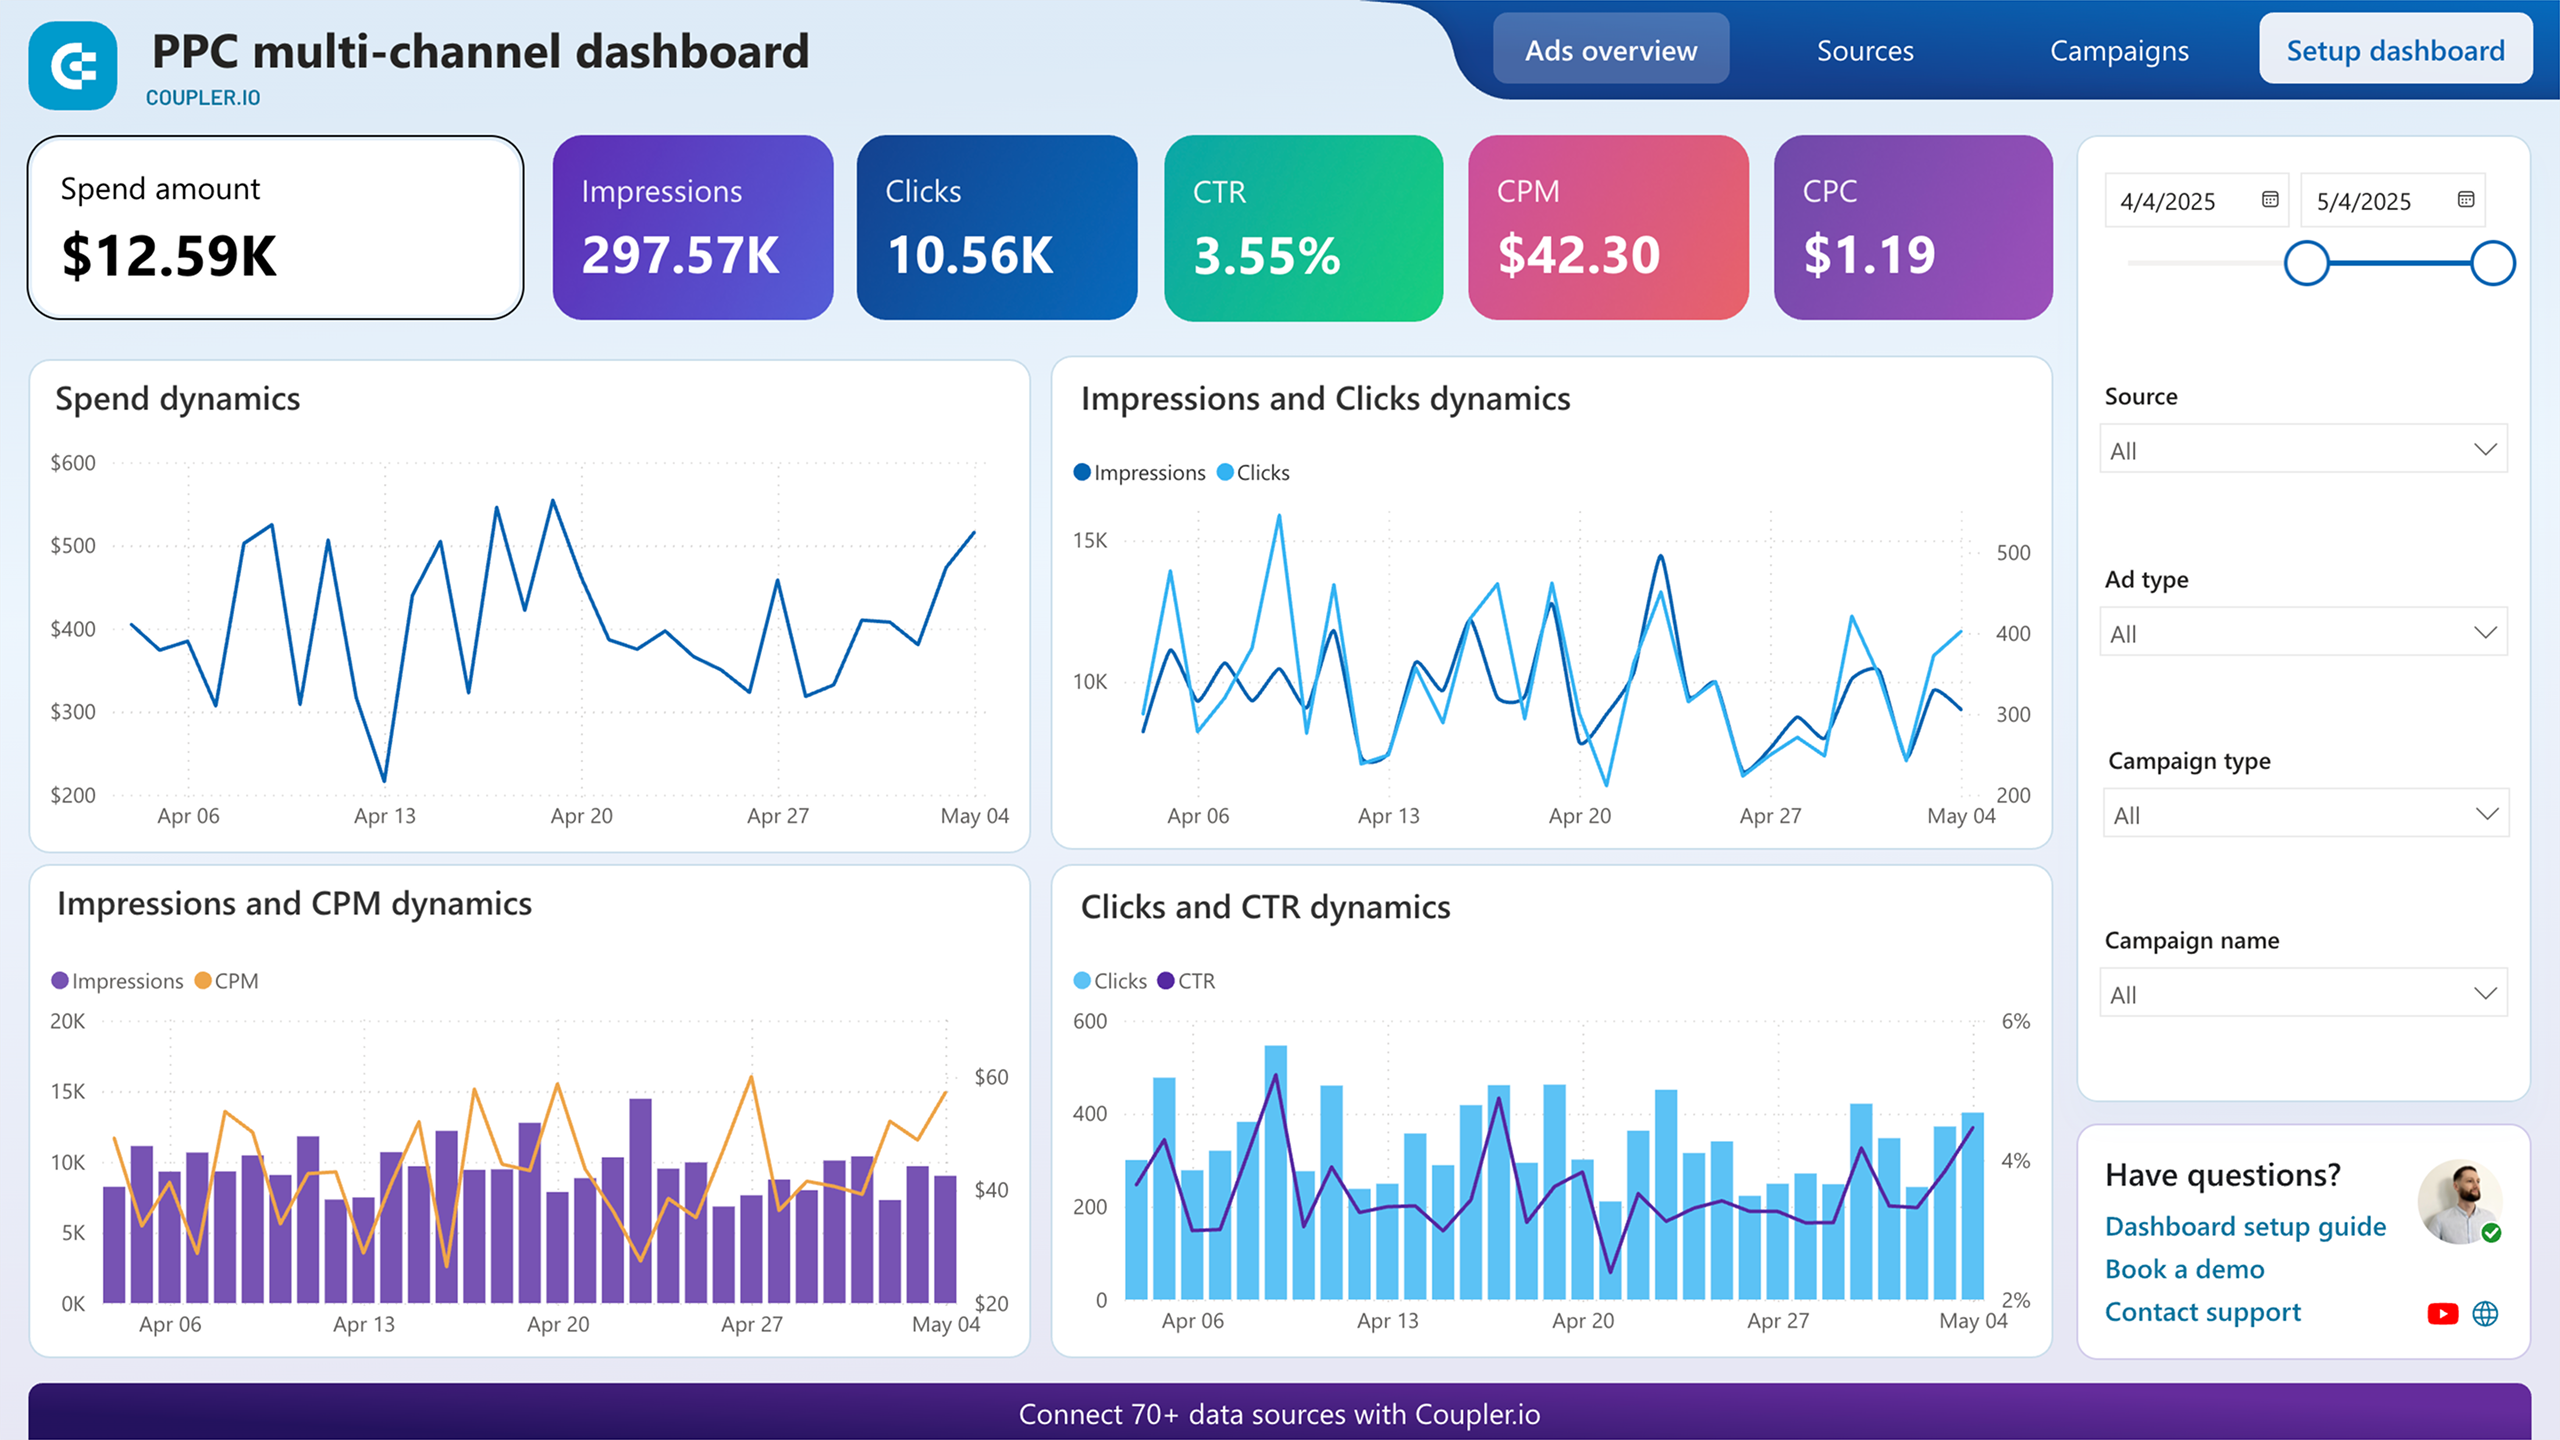
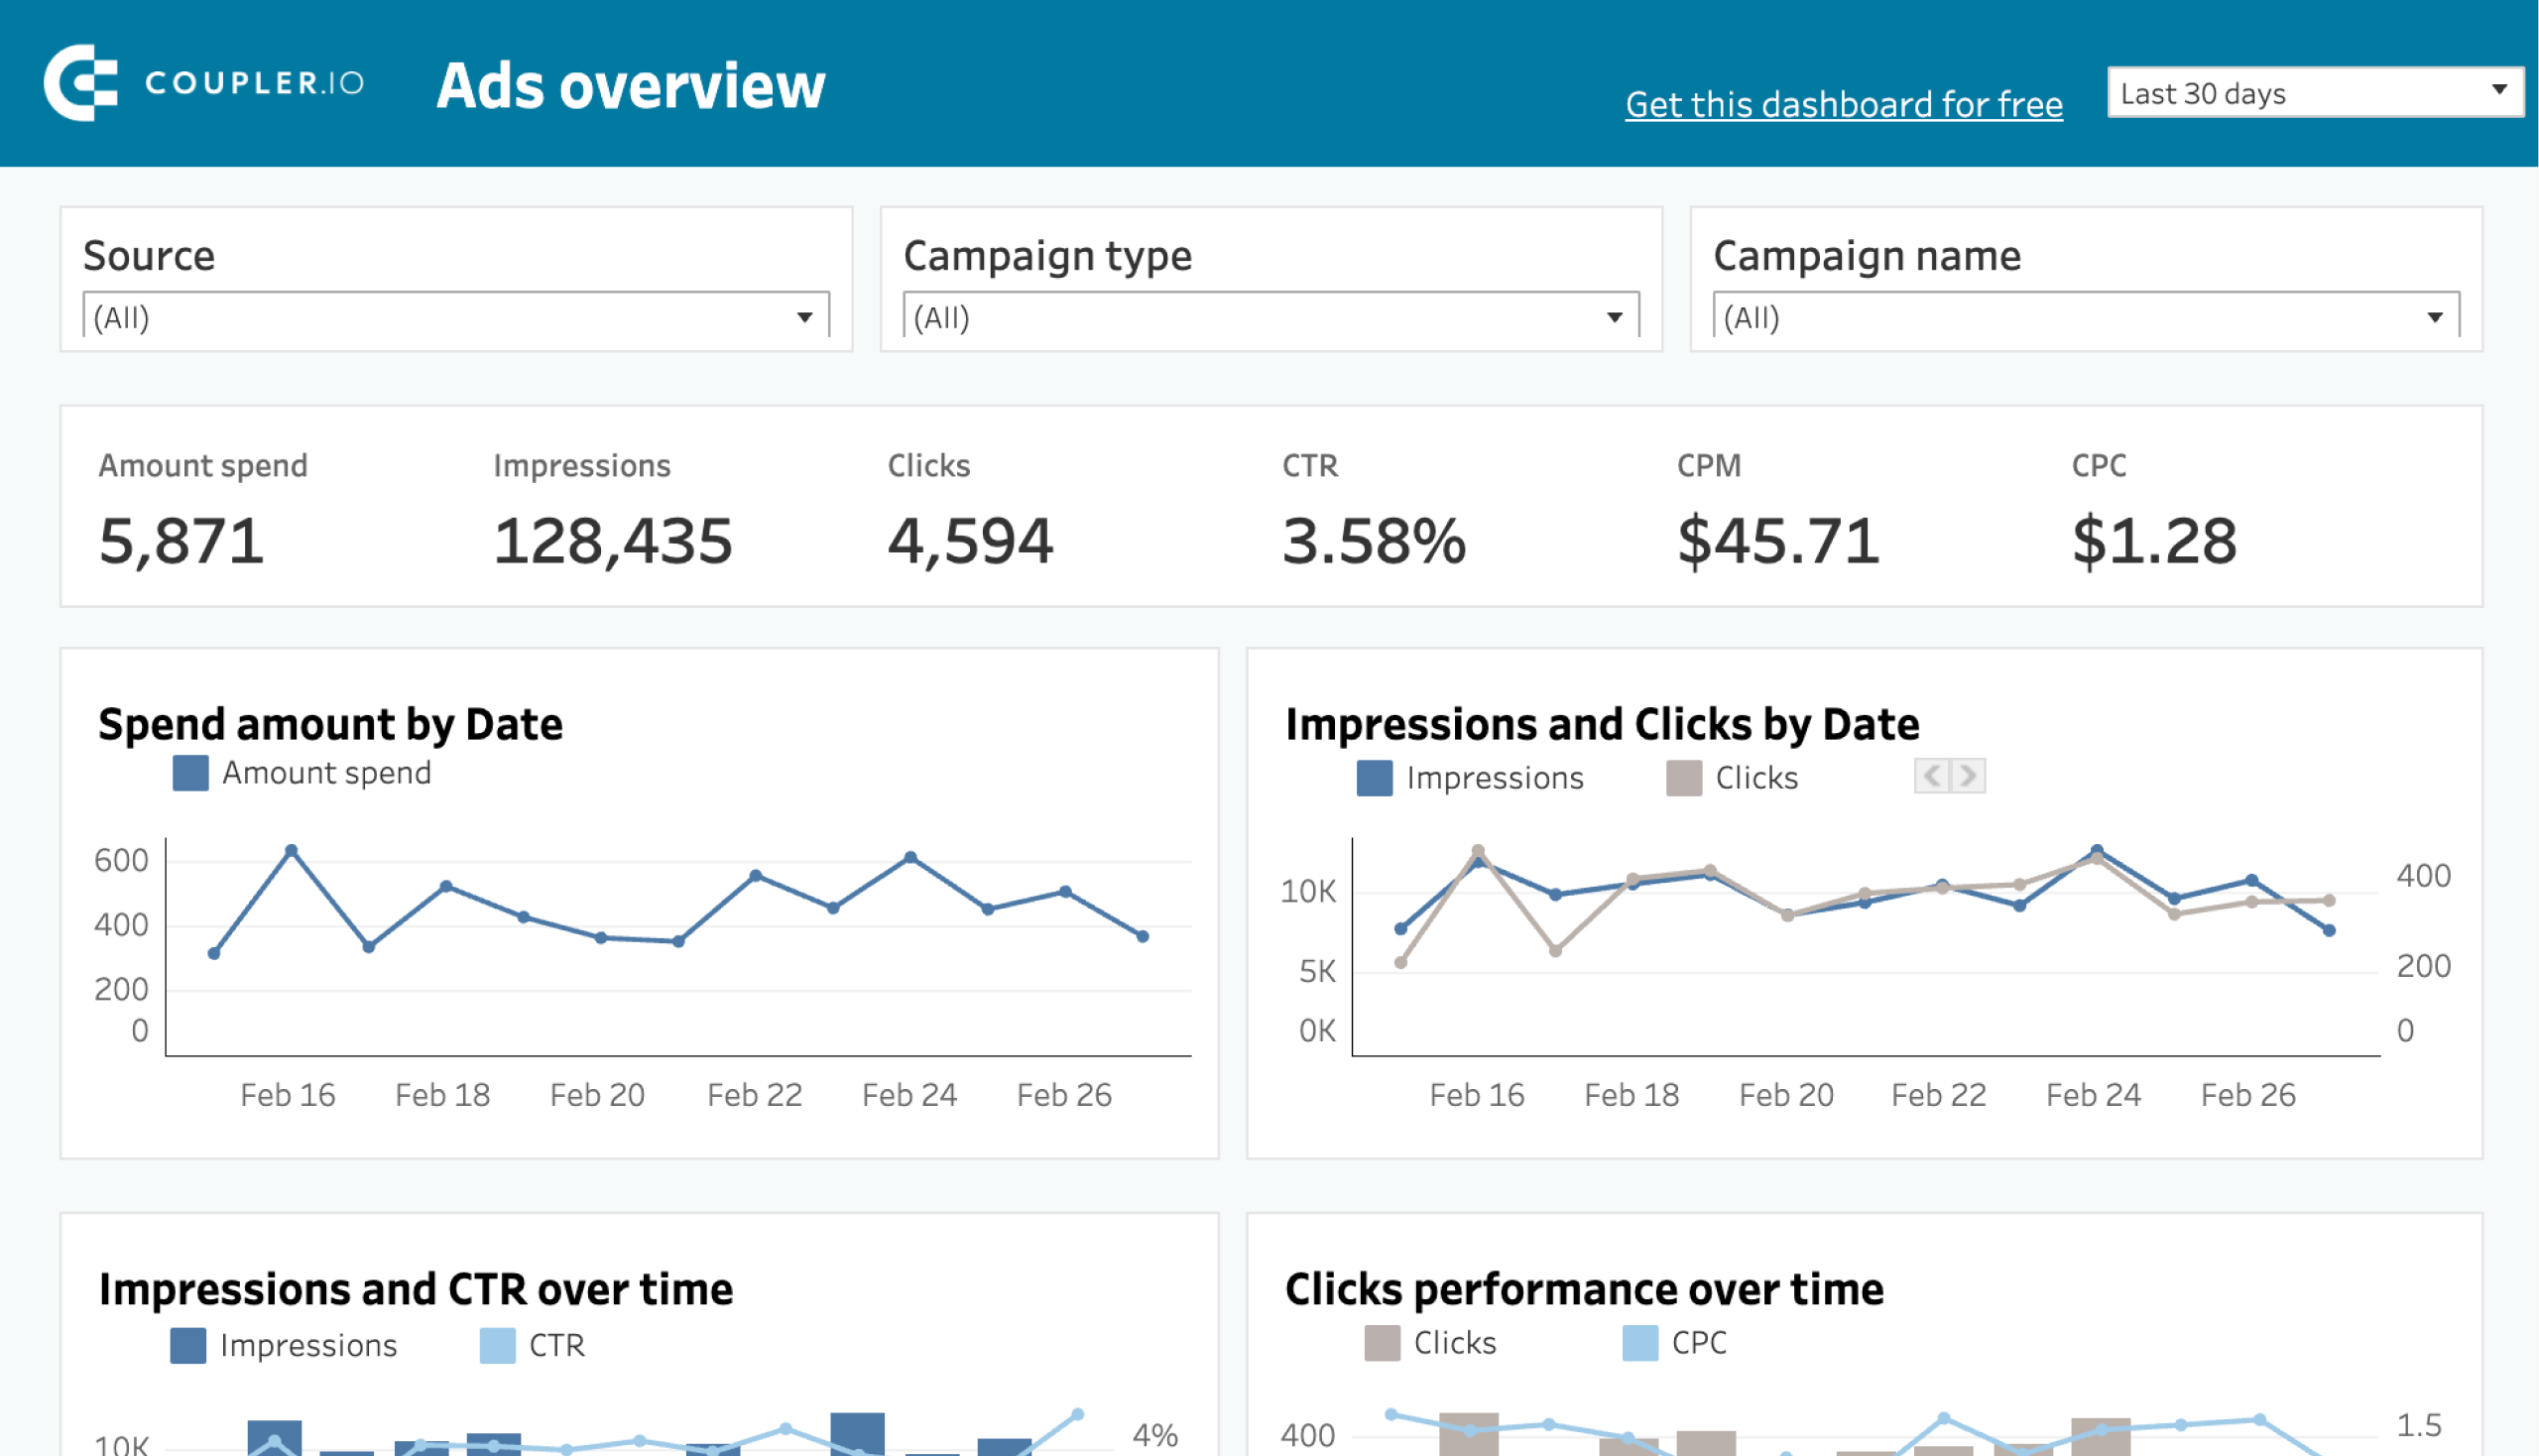
PPC multi-channel dashboard
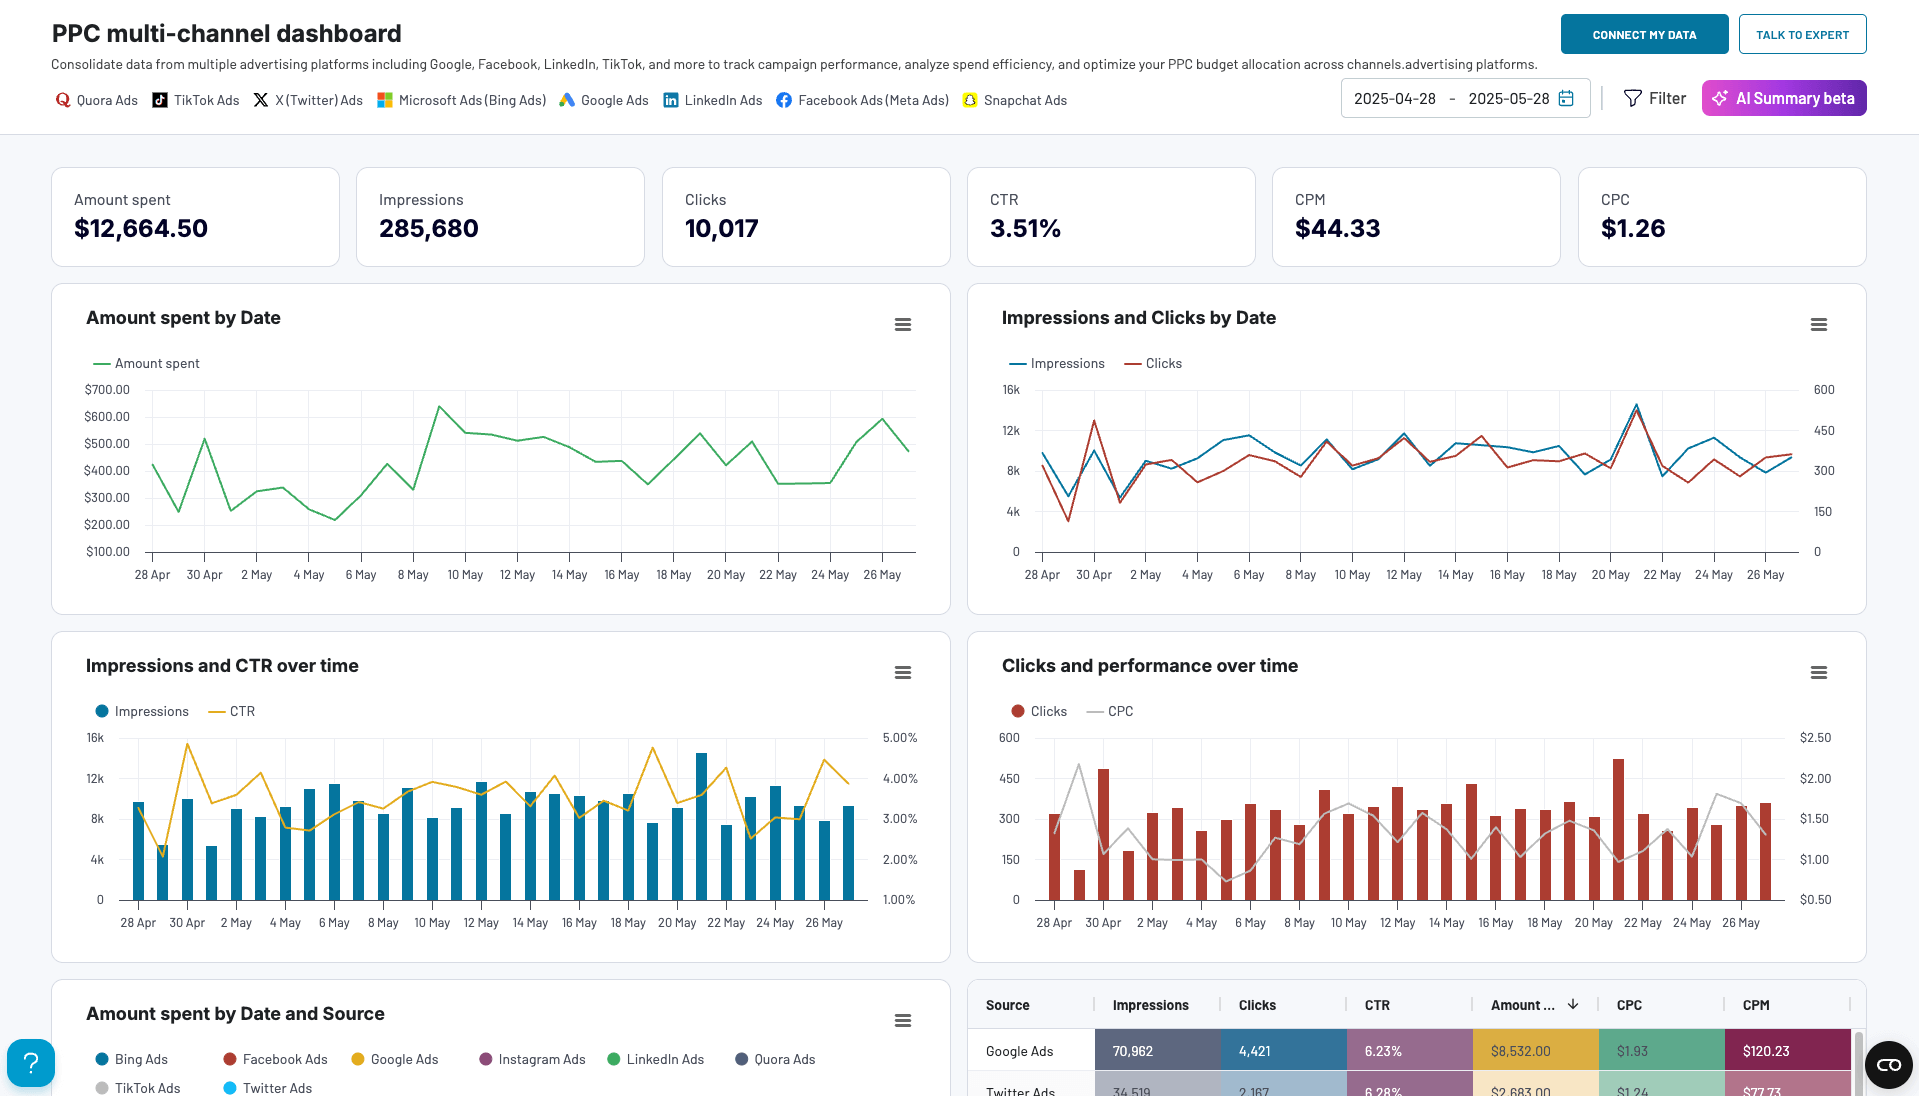
If you want to have a performance analysis of all your campaigns across multiple ad platforms, check out this dashboard template. It lets you aggregate data from LinkedIn Ads with records from Google Ads, Facebook Ads, and other sources. As a result, you can obtain an overview of ad campaign performance on multiple channels and compare it.
The dashboard template is available for different tools, including Google Sheets, Looker Studio, Power BI, and Tableau.


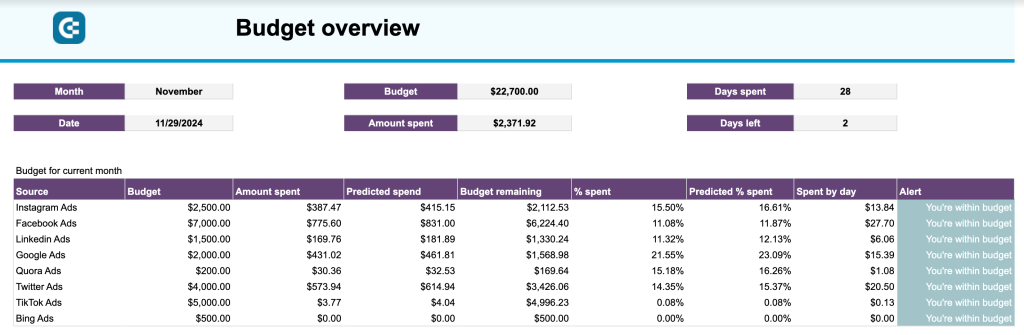
PPC multi-channel dashboard with budget
Budget tracking template for LinkedIn Ads
Budget tracking template for LinkedIn Ads
Preview dashboardThis dashboard template is useful for analyzing the financials of your LinkedIn campaigns. It provides a budget overview with spending predictions. In addition, you get alerts when there is a thread to overspend the budget.
The dashboard can be used solely for LinkedIn Ads or on multiple ad platforms. However, the template is only designed for Google Sheets.
How to build a LinkedIn Ads performance dashboard
If you’re interested in creating your own custom dashboard, the process can be broken down into two stages:
- Choose a data visualization tool and load data from LinkedIn Ads
- Visualize the data and set up the dashboard layout
Stage 1: Choose a data visualization tool and load data
You can build your LinkedIn Ads dashboard using spreadsheets or BI tools. The most common spreadsheet apps are Google Sheets and Microsoft Excel. If we talk about BI or data visualization tools, you can opt for Looker Studio, Power BI, Tableau, and others.
One of the choice criteria is LinkedIn Ads integrability. You need to ensure that your dashboard can be connected to LinkedIn Ads for constant data flow.
Fortunately, you won’t have any problem of choice if you use Coupler.io as a connector. This reporting automation platform lets you seamlessly integrate LinkedIn Ads with the spreadsheet and BI tools mentioned and beyond. You can organize your data on the go using filters and formulas and schedule data refresh as frequently as every 15 minutes!
In addition, Coupler.io supports other advertising data sources if you aim to create a cross-channel PPC dashboard.
To set up a LinkedIn Ads integration, complete the following steps:
Step 1. Collect data
Select the needed spreadsheet app or BI tool as the destination and click Proceed in the form below. You’ll be offered to create a Coupler.io account for free. Then, configure the connection.
Connect your LinkedIn account, then select ad accounts from where you want to extract data and a data category to export. For performance analytics, you should choose Report: ad analytics report.
Then specify the start and end dates of the report period, and choose how you want to see your statistics: view totals or split by day, month, or year.
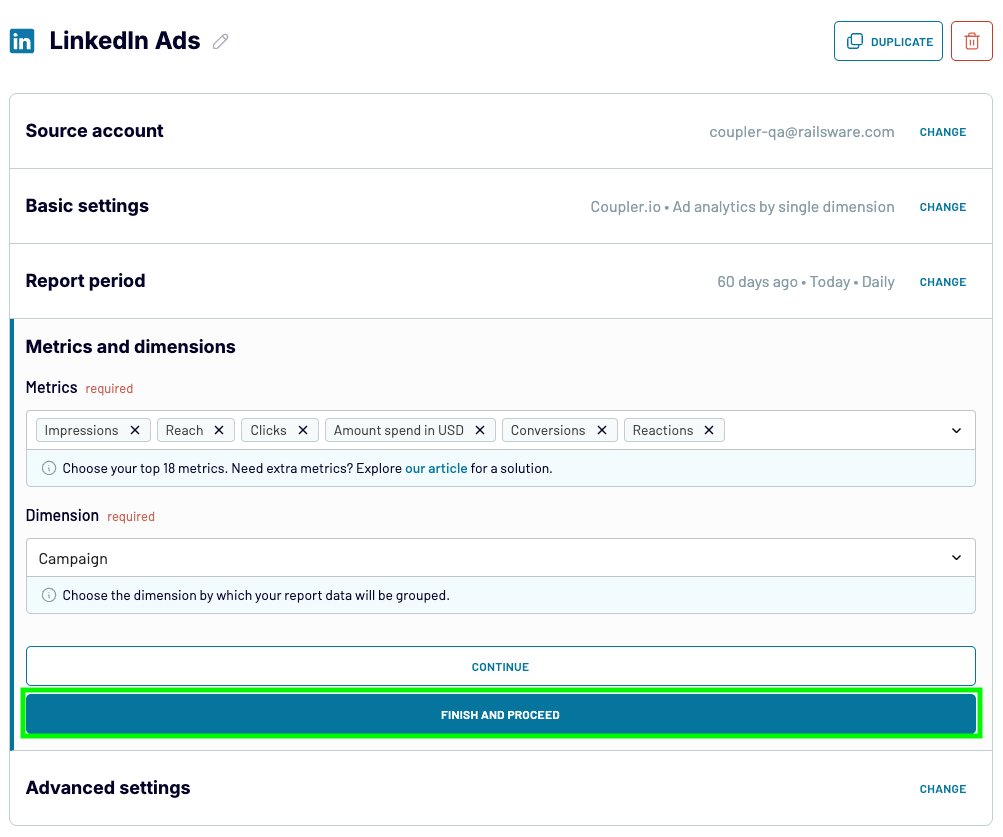
Eventually, select metrics and a dimension to include in your report.
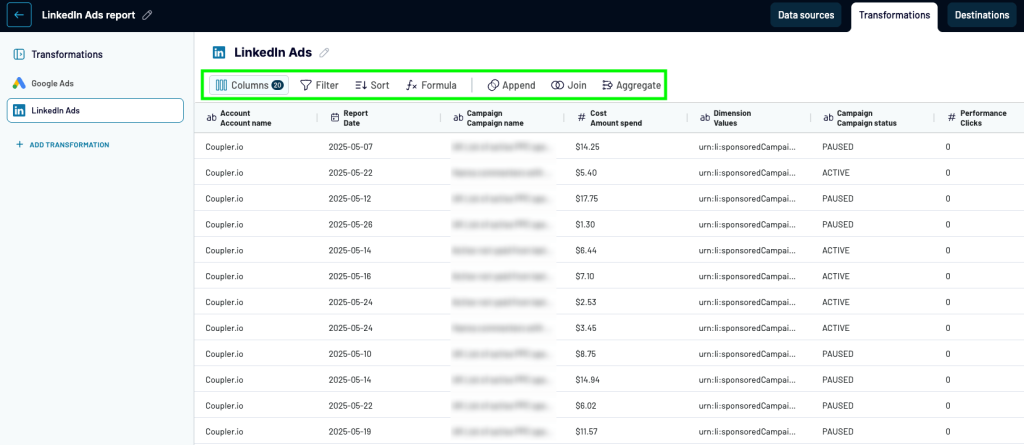
Step 2. Organize data
Before loading your LinkedIn Ads data, make sure it’s organized and analysis-ready:
- Hide, rename, and reorder columns, as well as change their data type.
- Add new columns using supported calculation formulas.
- Filter data based on the selected criteria and specified values.
- Summarize data with aggregation operations like sum, average, count, min, or max.
- Join data from multiple other sources, such as Google Ads and Facebook Ads.
Step 3. Load data and schedule refresh
The last step is to load the organized data to the selected destination. Follow the in-app instructions to do this.
Coupler.io also supports data warehouses as the destination, so you can connect LinkedIn Ads to BigQuery.
Make sure to enable Automatic data refresh and configure the schedule for it. This will make your dashboard self-updating, so it will always display up-to-date information.
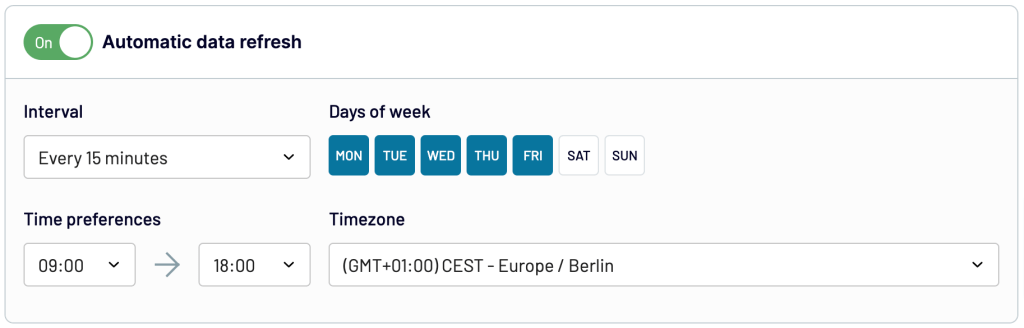
Click Save and Run to launch the importer and load your LinkedIn Ads data.
Stage 2: Visualize the data and set up the dashboard layout
With your data in the selected data visualization tool, you are ready to set up the dashboard layout. This involves choosing the type of chart or graph you want to use to display the data and the size and position of the chart or graph.
By now, you probably have an idea of what your objectives and metrics will be. Still, remember that you will use data from different sources, so ensure your goals are aligned. Doing so will give you a clear and holistic picture of all your advertising performance in one place.
What metrics allow you to measure performance
One of the main aspects of a successful campaign is identifying, tracking, and evaluating the correct metrics and KPIs. Even though often you’ll see that metrics and KPIs are used interchangeably, there is a difference between them.
Metrics are general, long-term performance measures, such as CTR or CPC. They are important because they help quantify the results of your ad campaign.
Key performance indicators, or KPIs, are targeted measurements of the success of your specific goals. To set up your KPIs, you need to understand the goals of your ad campaigns. This will help you understand what KPIs you need to track.
Below, you have some of the most important metrics you need to pay attention to when evaluating your LinkedIn Ads performance:
Cost per click (CPC) is the average amount that a business pays each time a user clicks on an ad. CPC helps businesses understand the cost of driving traffic to their website or landing page.
Conversion rate is the percentage of users who take a specific action after clicking on an ad, such as making a purchase or filling out a form. Through a conversion rate, you can understand how effectively ads are driving conversions and meeting advertising goals.
Cost per conversion is the total ad spend divided by the number of conversions. Cost per conversion allows companies to understand the cost of driving a specific action.
Cost per impression (CPM) is actually measured as cost per 1000 impressions or cost per mille, and it is the total ad spend divided by the number of impressions or the number of people who have viewed your ad.
Cost per lead is the cost of generating a lead or potential customer. In this instance, the cost per lead is the total ad spend divided by the number of leads generated.
Lead Gen form fill completion rate is the percentage of users who completed a lead generation form after clicking on an ad.
Engagement rate is a measure of the effectiveness of an ad in eliciting a response or interaction from the audience. It is calculated by dividing the number of times members interacted with the ad by the total number of impressions. These interactions can include a variety of social actions, such as reactions, comments, shares, and follows.
What can affect LinkedIn Ads performance?
Several factors can impact your LinkedIn ad performance. Some include ad targeting, such as specific job titles, or an ad format, such as a sponsored post or InMail. Your first priority should be identifying key goals. By setting goals, you can determine the most effective tools, strategies, and tactics to use in your ads.
Then, you have to get familiar with KPIs such as cost per click, cost per impression, and cost per action. These are essential for businesses to understand how much can be spent on acquiring new users, leads, demo bookings, customers, etc. It’s crucial to define these KPIs before starting any advertisement.
By doing so, you can identify the right metrics and PPC benchmarks for your ad campaigns. It’s important always to track their performance to see what is working and what needs improvement. Your goals and key metrics will allow you to maximize your ad performance and fine-tune your campaign for optimal results.
Learn more about data-driven performance marketing for SaaS.
10 tips for optimizing the performance of LinkedIn Ads
Maximizing the performance of your ads is an ongoing process, and even if your ads are performing well, it is always essential to look for improvement. Here are some actionable strategies to improve your LinkedIn Ads performance.
1. Test different audiences and optimize targeting settings
The correct targeting is crucial for making your campaigns efficient. If your audience is too broad, you will have to pay for impressions that don’t convert. Conversely, if your target group is too narrow, you may have to bid very high. Here are some steps you can take to achieve the correct balance:
- Update your buyer personas. Make sure your ideal customers’ descriptions align with your current goals. Do some additional research to see how your target audience may have changed and what new trends are affecting their lifestyle and needs. This can give you additional insights for targeting criteria and messaging.
- Identify the best-converting segments. Analyze your previous campaigns and see which audiences demonstrated the best results. Allocate more budget to the high-performing segments and use lookalike audiences.
- Run tailored campaigns for each segment. Create separate campaigns for different audiences – this allows you to better adapt your creative materials. Additionally, try targeting the same audience in different ways. For example, you can target the same cluster of professionals by industry, job function, and job title (as three separate campaigns). Be careful with targeting by age: some profiles don’t specify this information, so those people won’t see your ads.
- Make sure the audience size is right. The recommended audience for a LinkedIn Ads campaign is between 100,000 and 400,000 targeted people. For text ads, you can start at 60,000, while sponsored content performs best with audiences over 300,000. If your audience exceeds 3 million members, it may become challenging to achieve good results, so it’s advisable to keep it below this threshold.
2. Be flexible with the bidding strategies
- Make sure your bid is high enough. The system suggests a bid that will make your ads competitive. It’s advisable to bid a bit higher than the suggestion; otherwise, you may struggle to get enough impressions and clicks.
- Find the lowest CPC bid using LinkedIn’s manual CPC Bid option. This allows you to bid a designated amount on your ads to reach users that LinkedIn has identified as likely to click on your ad. The goal is to get the most clicks on your ads at the lowest cost possible, so it’s a good idea to start by bidding low and gradually increasing your bid.
- Adjust your bid during the campaign. You can decrease your bid after your campaign has been running for a while and you’ve been able to optimize ad creatives and CTR. If you’re pressed for time (for example, when selling tickets for events), it makes sense to increase your bid above the recommended amount, especially closer to the event. Additionally, it’s a good idea to bid higher at a time of the day when your audience is the most active.
- Experiment with automated and manual bidding. Test both options and analyze the results to determine which one is the most effective for you.
3. Optimize your ad budget
- Align the budget with your goals. LinkedIn allows you to choose daily or lifetime budgets that match your campaign goals. You also need to be realistic about your plans: the budget you set should be enough to reach the objectives you are aiming for.
- Prioritize top performers. Allocate more budget to campaigns and audiences that perform best and pause those that underperform.
- Check the broader picture. If you run ads on other PPC platforms besides LinkedIn Ads, check how different campaigns perform across channels. If LinkedIn Ads perform better than, for example, Facebook Ads, you can redistribute the budget accordingly.
You can use the dashboard template below to monitor and manage your ad budget across channels. It automatically collects data on all your ad budgets, gives you a performance overview, and builds budget usage projections for the future.
4. Improve landing pages and UI
- Align messaging and meet user expectations. When it comes to landing pages, consistency is paramount. Double-check that the messages in your ads are well-aligned with what a user encounters once they land on your website. If you are promoting a specific deal, your landing page should feature it as well. Avoid overwhelming users with your entire catalog; instead, guide them directly to the advertised product.
- Improve navigation and clarity. Once a user is on your landing page, they should be able to easily see what to do next and which button to hit. Messages like “Claim your offer here” or “Buy now” will help your audience navigate to the checkout. If you offer rewards for certain purchases, be clear on how to claim them. If you provide a promo code, it should be obvious where to paste it. Try to aim for a single action and pave the way for users to complete it.
- Analyze performance and user behavior. Combine data from LinkedIn Ads and GA4 to get a transparent view of user engagement. Utilize a behavior analytics tool, such as Microsoft Clarity, to dive deeper: it will provide you with heatmaps, recorded user sessions, and other information. By exploring how users interact with your landing page, you can see where they encounter difficulties. This enables you to optimize your website further.
- Make your landing pages mobile-friendly. Adopt a responsive design that will work well with any screen size and add mobile-optimized navigation. For example, make buttons big enough and place them so that it’s easy to reach them with a thumb when holding a smartphone in the palm. Don’t use images that take too long to load. Try tools such as TinyPNG to compress visuals so that they load fast even with a poor internet connection.
5. Optimize ad creatives and messages
- Design compelling creatives that stand out. Make sure your ad visuals are vivid, attention-grabbing, and engaging. Consider adding people to your images, use humour, if relevant, and clearly communicate your offer.
- Optimize ad messages. Keep your messages short and sharp, use your audience’s vocabulary to speak their language, and address their needs and professional challenges. If possible, incorporate social proof such as feedback from your clients, the number of users, and so on. Ensure that the call to action is clear and concise: “Sign up today,” “Buy now,” or “Learn more.” Test different messages for different audiences and analyze how this helps to improve the click-through rate.
- Try different ad formats. To achieve the best results, experiment with various ad types available on LinkedIn: Carousel image ads, Video ads, Text ads, Sponsored messages, and others. Then, check which ad formats perform best for different audience segments.
- Change creatives often. To keep getting attention and prevent ad fatigue, it’s recommended that you rotate new creatives once per month. LinkedIn suggests developing 4-5 ad variations for each campaign and running them all at once. Then, you can see which ads produce the best outcomes and which can be paused.
6. Implement AI tools
- Use AI to craft messages and generate ideas. Rotating multiple sets of creatives is easier with AI tools: for example, Claude, ChatGPT, Gemini, etc. Give them detailed prompts, including the context and purpose of the messages you need. Provide LinkedIn audience description, product USPs, and, basically, everything a human writer would need. Then, use the generated messages as a basis for your creatives. Apart from texts, AI tools can be helpful for brainstorming campaign ideas.
Explore how to connect LinkedIn Ads to Claude for conversation PPC analysis.
- Produce videos and images. Working on videos used to take significant time and effort. Now, AI tools have drastically simplified this process. With solutions such as Synthesia or inVideo, you can easily turn text into footage with a professional voiceover and a human presenter. In addition, there are ready-made video templates to speed up production even further. Other tools, such as MidJourney or Copilot, can generate images based on text prompts.
For more ideas on how to use AI, please have a look at our article 25+ Best AI Marketing Tools.
7. Leverage geotargeting
- Run tailored campaigns. Prepare separate campaigns for different geographical areas. You can use location-specific insights and messages to make your ads more relevant to potential customers in different countries or cities. This can help you optimize click-through rates. Analyze the results and give more attention to the most promising regions: increase your bid, allocate more budget, or test additional creatives.
8. Use the advantages of retargeting
- Prepare a re-engagement campaign. Retargeting is one of the important parts of LinkedIn Ads optimization. “Warm” audiences often demonstrate better conversion rates than “cold” ones. Analyze your funnel and explore user behavior in detail to determine the reasons why interested customers didn’t convert before. Maybe they left because the landing page was confusing or the checkout process was too complicated. Address potential issues and run a re-engagement campaign.
- Target narrow sub-types with laser-focused messages. Based on the previous user behavior analysis, group your retargeted audience into subtypes and prepare a tailored campaign for each. For example, if you are targeting 900,000 people, the optimal choice would be to run three separate campaigns for 300,000-member groups.
9. A/B test multiple campaigns and other settings
- Compare the results for different campaigns. When you run several campaigns for one audience, region, or product, remember to analyze the outcome. As always, prioritize the options that produce the highest CTR and purchase rate and pause the others. This practice is crucial for LinkedIn Ads optimization.
- Test creatives and settings. Basically, it makes sense to A/B test everything: ad copy, visuals, CTAs, campaign ideas, bidding and targeting settings, and more. Just click New Campaign, select Duplicate Existing, and then change one element to see how it will affect the outcome.
- Refine your choices. Once you have determined the best combination of the creatives, audience segments, and other settings, continue to A/B test to keep improving the results. However, a campaign should run for long enough to allow you to collect representative data. It is recommended to wait at least 7 days before analyzing campaign results.
10. Track and analyze results regularly
- Monitor and optimize the key metrics. Utilize the overview in LinkedIn’s Campaign Manager or custom reports outside LinkedIn to track the key metrics and ensure they meet your goals. The main metrics to focus on are Impressions, Click-through rate (CTR), Cost per click (CPC), Cost per mille (CPM), and Conversions. Additionally, it’s crucial to analyze user demographics.
- Analyze results dynamically and implement changes on the go. Build a live dashboard in a BI tool or create an auto-updating report to ensure access to the latest data. Equipped with a report with real-life metrics, you can perform continuous analysis. This enables you to adjust your strategy on the go, amplifying success and preventing issues before they emerge.
- Optimize reporting with ready-made templates. To spend less time on LinkedIn Ads reporting and more time on analysis, use customizable templates. Additionally, consider using a reporting automation platform like Coupler.io to collect data and send it to your reports automatically.
What are the LinkedIn Ads benchmarks to follow?
LinkedIn ad benchmarks are statistical averages that serve as a starting point for assessing the efficacy. They will help you evaluate how your campaign compares to other efforts on the platform.
Understanding LinkedIn ad benchmarks can help you determine the effectiveness of your advertising campaigns and make adjustments as needed. Some benchmarks to consider when evaluating the performance of LinkedIn ads include:
LinkedIn InMails: or message ads are paid messages that appear in the inbox of a LinkedIn user. The open rate is the percentage of people who opened an InMail message out of the total number of people who received it. The average open rate, regardless of industry, is 55%.
Clickthrough rate (CTR) InMails: applies to InMail messages with a link embedded in them and is the percentage of people who clicked on that link. An average CTR is just over 3%.
LinkedIn Video Ads: are sponsored videos that companies run on the platform. They can appear on a user’s feed or in inboxes. An average engagement rate is just over 1.5%.
LinkedIn Conversation Ads: are sponsored messages that appear in users’ LinkedIn messaging inboxes. They are very similar to LinkedIn InMails, but the difference is that they are usually more casual. The benchmark for open rate for conversation ads is similar to InMails at over 50%, while the CTR is higher at just over 10%.
LinkedIn Live and Virtual Event: This feature allows users to stream live videos on the LinkedIn platform. It is usually used to host webinars, panel discussions, or Q&A sessions. The usual engagement rate benchmark for a live and virtual event is around 10%.
Using LinkedIn ad benchmarks can help you set and measure goals for your advertising campaigns. Once you identify your advertising goals, choose the appropriate benchmarks that you think will help you achieve them. Use those benchmarks as a baseline in monitoring and measuring your progress.
Why is it important to monitor LinkedIn Ads performance?
In the grand scheme of things, measuring your LinkedIn ads performance is important to be more efficient with your advertising efforts. For instance, you can identify successful campaigns and replicate the same strategies in the future. Also, this lets you identify trends in your data to understand seasonality or changes in audience engagement. As a result, you can make strategic decisions about how to properly adjust your targeting so that your ads reach the most relevant audience.
Maximizing the impact of your LinkedIn Ads performance
Also, you have to consider what industry you are in because CPC prices can vary. Historically, Tech has the highest CPC bids, while the education industry has the lowest. Maximizing your performance is an ongoing process, so make a plan and always start small. You can always branch out to different tools and strategies if needed. If you are advertising on multiple platforms, consider integrating your data. This will help you streamline your data analysis and uncover areas of improvement. So remember, the goal of maximizing your performance is to save you money as well as time.
Measuring LinkedIn Ads performance is an ongoing process, where you have to define your goals and metrics and constantly measure their performance. Optimize LinkedIn Ads targeting, A/B test your ads, set up conversion tracking, and monitor your performance with live LinkedIn Ads reports. Use dashboards to have a full and clear picture of all your data and streamline LinkedIn Ads analytics.
Finally, always look for relevant benchmarks to ensure you are effective with your advertising efforts, and always try to maximize your ROI.

Automate LinkedIn Ads reporting with Coupler.io
Get started for free