We can all agree – getting insight into your sales performance is crucial for your business. If you use Pipedrive, you can use reports in their Insights feature to keep track of your sales pipeline and forecast your sales.
In this article, we’ll show you how to use reports in Pipedrive. We’ll cover the different types of reports available and show you how to use them to track your progress and improve your sales performance. Additionally, we’ll show you a possible option on how to do reporting outside of Pipedrive.
Comparing Pipedrive reports across different plans
First off — let’s compare reports on Pipedrive across different subscription plans.
There are four different subscription plans on Pipedrive: Essential, Advanced, Professional, and Enterprise. The higher the plan, the more reports, report types, and customization options you get. Here are the key differences between the plans as they relate to Reports:
- The number of reports you can have varies depending on the subscription plan you are on. The limit is per user: 15 for Essential, 30 for Advanced, 150 for Professional, and unlimited for Enterprise.
- If you’re a Professional or Enterprise plan user, you can use deal custom fields for filtering and building reports in the Visual Builder (in the Measure by, Segment by, and View by dropdowns).
- The availability of report types also depends on your subscription plan. The Essential and Advanced plans include reports on deals, leads, and activities, while the Professional and Enterprise plans can access all types of reports. See the following table for details:
| Report types | Essential | Advanced | Professional | Enterprise |
|---|---|---|---|---|
| Deal performance | ✔️ | ✔️ | ✔️ | ✔️ |
| Deal conversion | ✔️ | ✔️ | ✔️ | ✔️ |
| Deal duration | ✔️ | ✔️ | ✔️ | ✔️ |
| Deal progress | ✔️ | ✔️ | ✔️ | ✔️ |
| Lead performance | ✔️ | ✔️ | ✔️ | ✔️ |
| Lead conversion | ✔️ | ✔️ | ✔️ | ✔️ |
| Activities performance | ✔️ | ✔️ | ✔️ | ✔️ |
| Emails performance | ✔️ | ✔️ | ✔️ | ✔️ |
| Subscription revenue | ❌ | ✔️ | ✔️ | ✔️ |
| Revenue forecast | ❌ | ❌ | ✔️ | ✔️ |
Pipedrive custom reports
When you create a report in Pipedrive, a default one is generated based on the type of report you selected. You can later tailor it if needed. For example, a deal report may track the number of deals as the default criteria, but you can customize it to track the deal value. Then, you can also filter and group the results to get a clear visual overview of your sales performance based on your specific needs.
The problem with Pipedrive is that they only offer basic analytics and customizations. Building reports outside of their platform provides many benefits if you want more advanced customization! Let’s say, you want to group by a field that isn’t available in the dropdown or wish to use a chart that Pipedrive doesn’t support. For a solution, simply export your data from Pipedrive and create reports using Google Data Studio, Power BI, or even spreadsheet apps like Excel or Google Sheets.


There are several ways of exporting Pipedrive data, with one option being downloading it manually as Excel or CSV files. You can also automate the export process from Pipedrive to Excel using an integration tool such as Coupler.io. It allows you to export data on a schedule like daily, hourly, etc., which is best if you want to build reports that refresh automatically.
Pipedrive reporting functionality
Pipedrive offers a range of powerful reporting and dashboard functionality to help you better understand your sales data. While this article focuses more on reports, check out our other article about what’s possible with the Pipedrive Dashboard. Also, see our blog post on connecting Pipedrive to Looker Studio to get free Pipedrive dashboard templates.
Now, let’s take a look at how to use reports in Pipedrive. The Pipedrive reporting interface is intuitive and easy to use, allowing you to easily access, create, customize, and export the reports.
How to access Pipedrive Reports
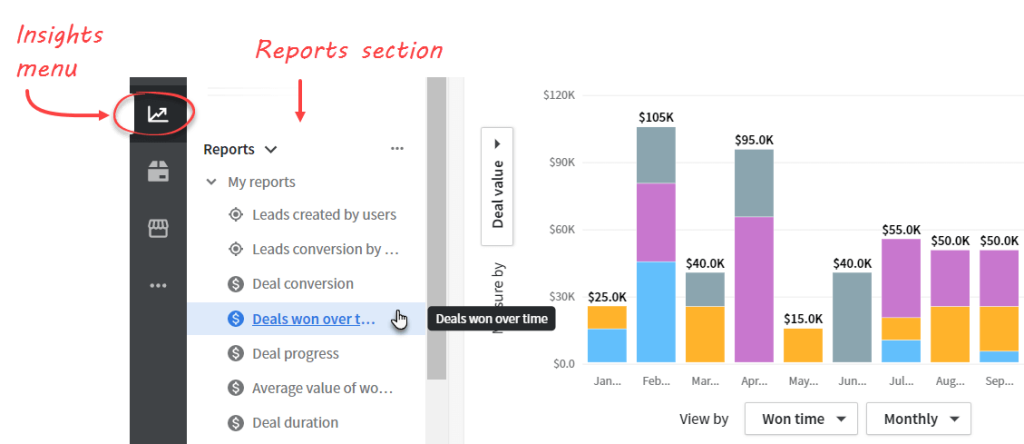
To access Pipedrive reports, click Insights on the primary navigation bar. On the Reports section, click any report you have on the list. You’ll see the report displayed on the right side.
How to create Pipedrive Reports
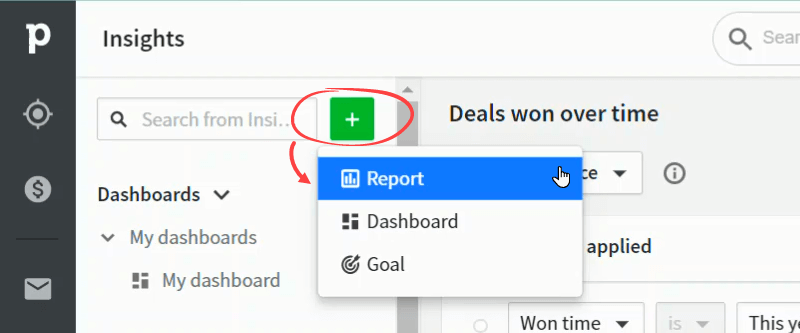
The first step to creating a new report is by clicking the green button with a plus (+) icon next to the search bar. Then, on the dropdown menu that appears, select Report.
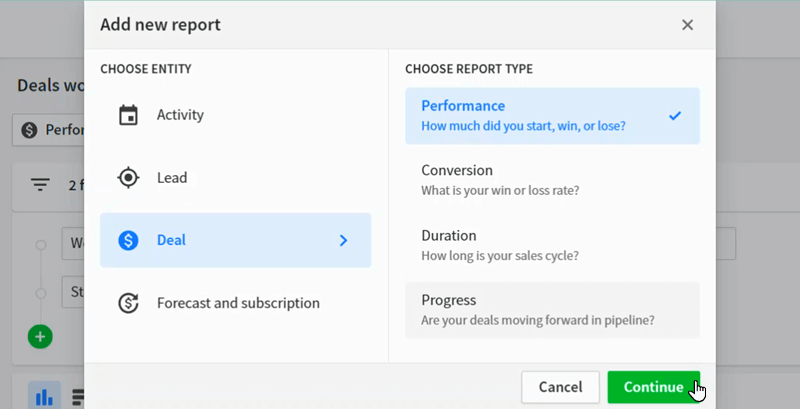
Next, choose the type of report you want to create and click Continue. For example, we select a deal performance report in the following screenshot.
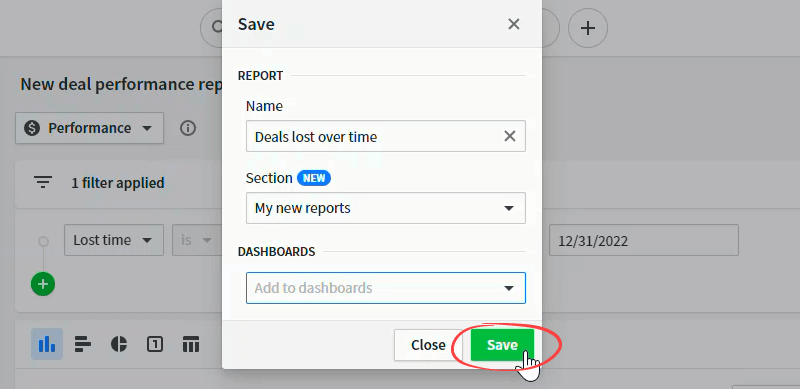
Review the new report created. If everything looks good, click on Save in the right corner.

On the Save window that appears, enter the report’s name, add the report to any section, and add/remove it from dashboards. You can also create a new Section and Dashboard from this window. When done, click Save.
How to customize & update Pipedrive Reports
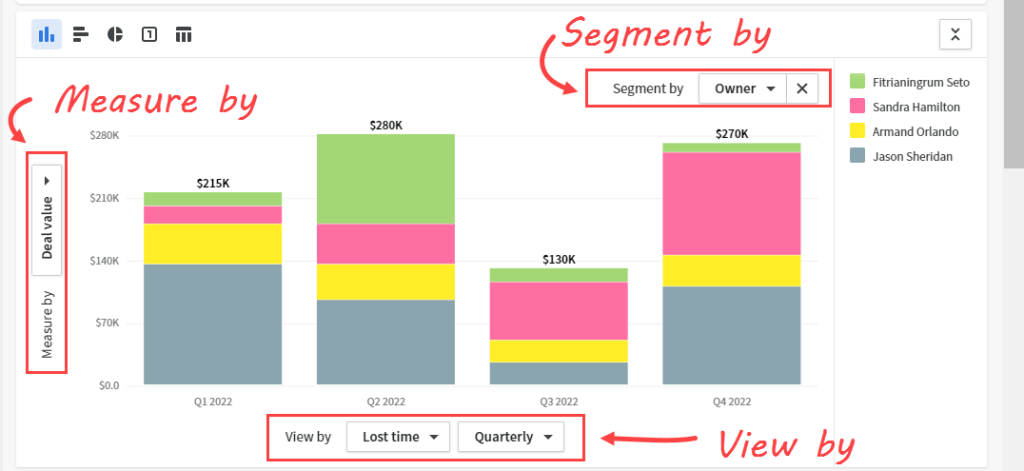
You can further customize the fields you want to measure, segment, and group your data by in the report if you like. To do that, change the value of Measure by, Segment by, and View by dropdowns in the Visual Builder, as the following screenshot shows:
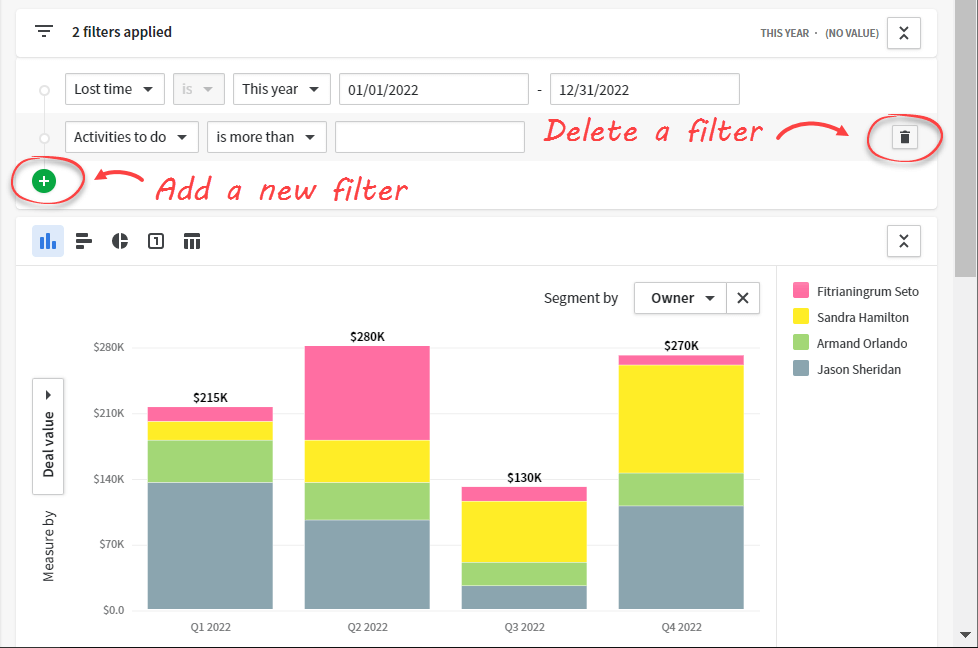
You can also change or delete an existing filter for your report or add more conditions to specify your data further. The visualization in the report will be automatically updated based on the changes you made in the filter conditions.
When done customizing your report, hit the Save button to save your changes or Save as new to save your report as a new one. You can also click Discard changes to abort your changes.

Renaming an existing report is easy. Just click on the report name and type a new one. After that, click anywhere outside the text box. Your changes will be saved automatically. ?

How to export reports from Pipedrive
To export data from your Insights report, scroll down to the list below the report and click Export on the right. A popup will appear, allowing you to choose which file type you would like to export the results to — either CSV or XLS.
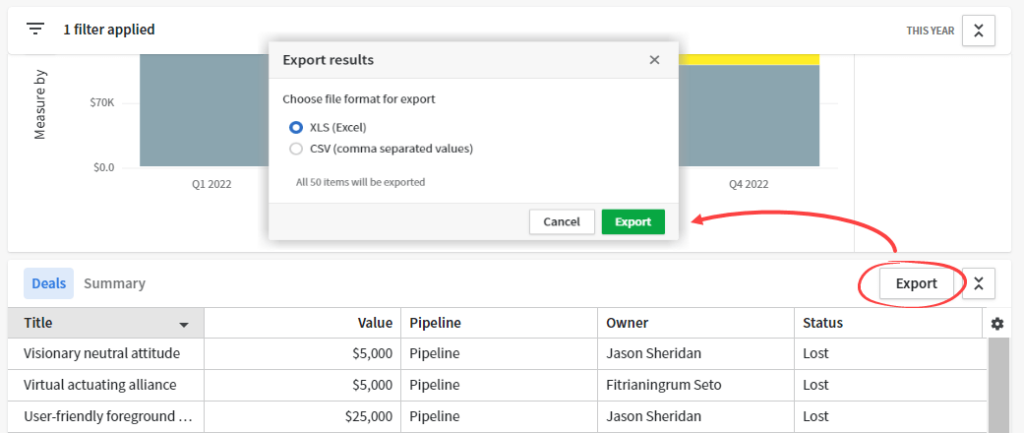
Click the green Export button inside the popup. Once the export is ready, you can download the file.
Customizing columns to export
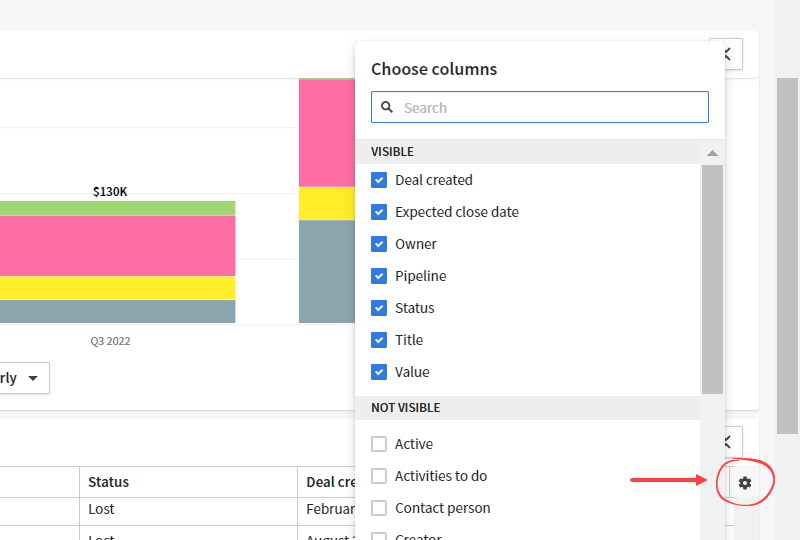
To customize the columns you would like to export, click on the setup icon (gearwheel) next to the report grid and select/deselect fields you want to export. This will also reflect on the grid.
Exporting individual data points
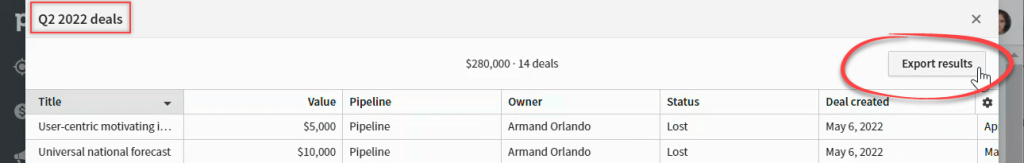
You can also export individual data points from your report. Click on a data point in any column, bar, or pie chart to do this.
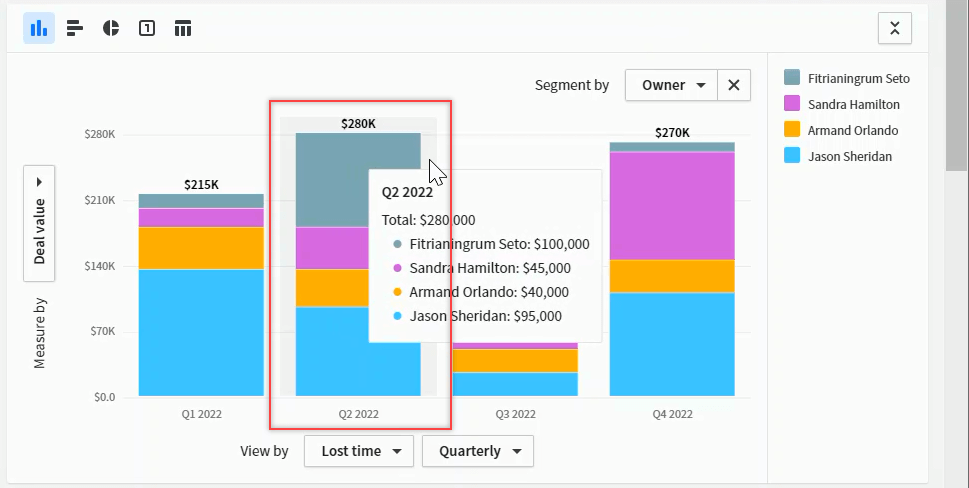
A window showing a preview of the data that will be exported will appear. Click on Export results to export your data.
Reporting out of Pipedrive
Pipedrive allows you to do basic customization for your reports by changing the fields you use to filter, measure, segment, and group your data. However, as explained previously, you may want to create reports outside of Pipedrive for more advanced customizations. For example, if you want to use charts or perform analysis that is not supported by the platform.
You will need to export data from Pipedrive and create visualizations in other tools such as Excel, Tableau, or Data Studio. The process can easily be automated on schedule with an integration tool. And in this section, we’ll show you how to do that using Coupler.io.
Pipedrive: export reports’ data to a spreadsheet or database using Coupler.io
Coupler.io makes it easy to set up an automated export of your data in Pipedrive on a schedule so that you can generate custom reports based on that exported data!
Sign up to Coupler.io and create an importer. Then, follow the simple steps below to configure the importer:
- Choose Pipedrive as the data source and Excel as the destination. As you can see, you also have the option to export your data to Google Sheets, BigQuery, as well as integrate Pipedrive to Power BI or Looker Studio.
- Connect to your Pipedrive account and select a specific entity: Deals, Persons, Organizations, Activities, Files, Leads, Call logs, or Products.
- Jump to destination settings and connect to your Microsoft account.
- Select an existing workbook where you’d like to export your Pipedrive data.
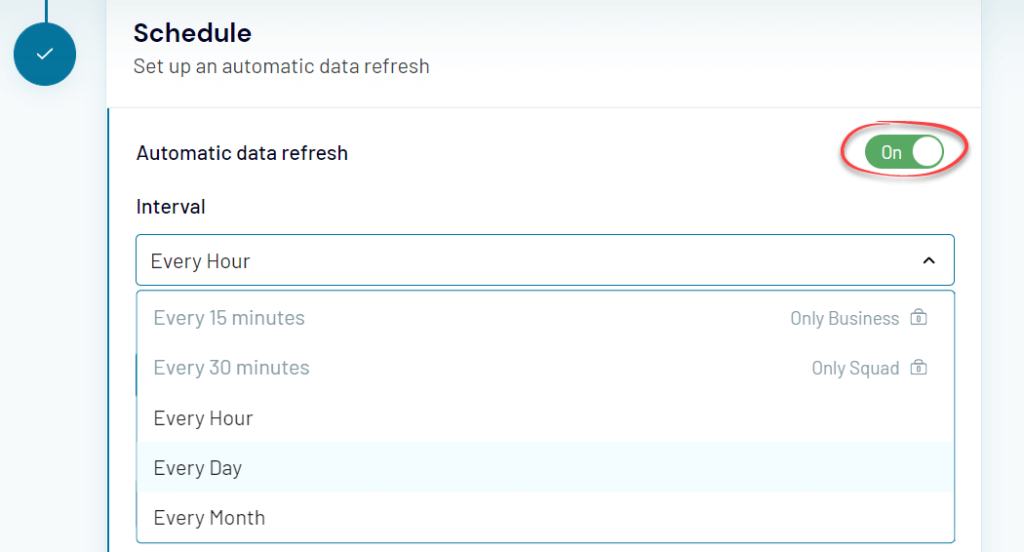
- If you want, you can schedule reports at a custom frequency.
- Give your importer a name and run it. Coupler.io will bring your data from Pipedrive to Excel automatically.
Build reports in spreadsheets or other reporting platforms
After having your Pipedrive data exported, you can create custom reports in Excel or other platforms. Also, Coupler.io provides a Pipedrive MCP to integrate your data with AI. This is a great way to get more insights into your sales data and spot trends you may not have noticed before. You can also share your reports with your team members or clients so that they can see what is going on in your sales pipeline and even collaborate to edit the reports.
Types of Pipedrive Reports
As of this writing, you can create ten report types in Pipedrive. These report types depend on these data entities: Lead, Deal, Activity, Forecast, and subscription. Let’s see what they are and what insights they give you.
10 Pipedrive Insights Report Types
| Entity | Report type | Insight |
|---|---|---|
| Deal | Deal Performance | How many deals were won, lost, and started? |
| Deal Conversion | The conversion rate of when a deal moves from stage to stage or from open to closed. | |
| Deal Duration | The average time of your sales cycle. | |
| Deal Progress | How well your deals are progressing through your sales cycle | |
| Lead | Lead Conversion | What percentage of your leads are converting to deals |
| Lead Performance | How many leads were created, archived, or converted to leads in your Pipedrive account | |
| Activity | Activities Performance | Track your activities progress and your teams’ |
| Emails Performance | Track your email performance of all emails sent or received using our Email Sync or Smart Email BCC features. | |
| Forecast and subscription | Revenue Forecast | Enables you to estimate your future revenue, understand what deals have been closed, and what deals need to be closed. |
| Subscription Revenue | The total amount of revenue generated by recurring, one-time, or payment schedule type revenues, according to the time frame selected. |
Different visualization options for Pipedrive Reports
Pipedrive reports allow you to see results in five different types of charts: column chart, bar chart, pie chart, scorecard chart, and table chart. However, some of them can only be displayed in one or several charts.
To see different visualizations of a report, click on the different chart icons in the Visual Builder. See the following screenshot as an example:

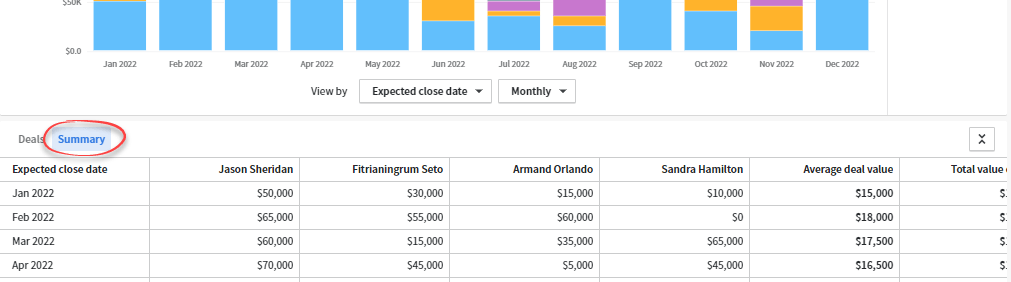
Summary reports in Pipedrive
While scrolling down the Pipedrive reports, you may come across a section that contains summary information. You may want to export these summary reports in Pipedrive for later use, but unfortunately, it’s not possible. However, you can always create your summary table outside of Pipedrive.
History reports in Pipedrive
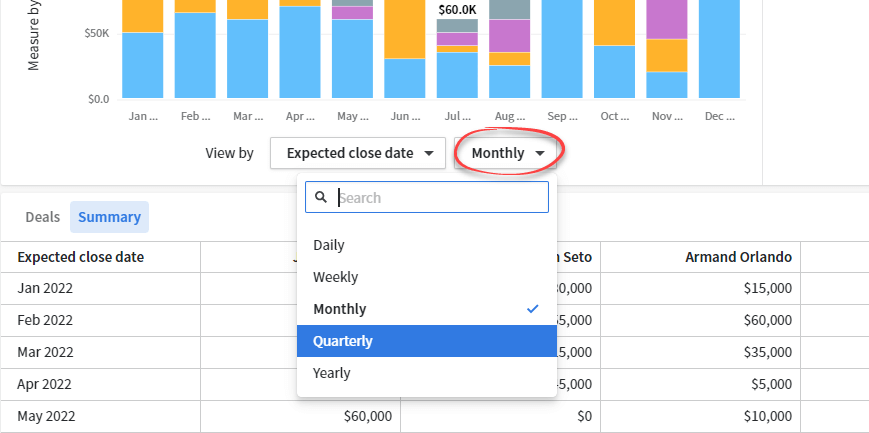
You can have historical views that show how your numbers change over time. This is possible for some reports that allow you to group by a time field.
In the dropdown next to the View by dropdown, you can adjust how you see your data: Daily, Weekly, Monthly, Quarterly, or Yearly. History reports in Pipedrive allow you to track your data over time and help catch any trends that might not be immediately obvious when viewing the report individually.
Pipedrive Reports – Wrapping up
Pipedrive reporting provides you with various types of reports for the basic analysis of your sales data. However, for more complex analysis and richer visualizations, it’s best to export your Pipedrive data to perform further customization or analysis outside of the platform.
With Coupler.io, you can even automate the export process on the schedule you want, conveniently without coding. This will give you a significant advantage when it comes time to create reports and dashboards with data that is always up-to-date.
Finally, thanks for reading, and good luck with your analysis!
