Claude for Ecommerce Analytics: How to Turn Your Store Data Into Answers You Can Trust

Claude (Anthropic’s AI) can act as your always-on ecommerce analyst. Ask it why revenue dropped, which SKUs to stop advertising, or whether last weekend’s sale actually made money, and get an answer with a recommendation, not just a chart.
You’ve probably already tried it. You exported your Shopify orders, dropped the file into Claude, asked “what’s driving revenue this month,” and got back a confident answer that was quietly wrong.
That’s the thing most people run into first, and why they give up.
“Claude can’t analyze my store” isn’t the real issue. It’s that a spreadsheet in a chat window is the worst possible way to feed it data.
Set it up properly and Claude becomes something closer to an always-on analyst.
This guide walks from “paste a file and hope” to “ask my whole business anything and trust the number that comes back.”
The core of this is a data layer that pulls your sources together and hands Claude verified numbers instead of raw files, and Coupler.io is the layer this guide uses to do it. By the end you’ll know what Claude is good and bad at for ecommerce, how to connect your data so the numbers hold up, how to keep it from hallucinating, and the daily questions that make it worth using.

Get ecommerce insights in Claude with Coupler.io
Start for freeWhat ecommerce analytics with Claude actually looks like
Before you connect anything, it helps to know where Claude is strong and where it will let you down if you lean on it blind.
What Claude is good and bad at
Claude is strong at the interpretation work. It reads a trend and tells you what changed, explains an anomaly and ranks the likely causes, compares cohorts, and blends qualitative and quantitative reasoning in a single answer, like “returns on this SKU jumped and the customer support tickets mention sizing.”
That’s the analyst’s actual job, and Claude AI does it well. It’s also good at spotting patterns and helping you identify trends you wouldn’t think to query for.
Where it struggles is anything that needs live data or exact math it can’t verify.
Real-time inventory levels, precise margin calculations without a calculation layer underneath, and live on-site session behavior are not things a language model should compute on its own.
It’s a language model, not a calculator or a live database. Ask it to add up thousands of rows and it doesn’t calculate, it predicts what the total probably looks like.
| Claude is strong at | Claude is weak at (without the right setup) |
|---|---|
| Interpreting trends and explaining what moved | Real-time inventory snapshots |
| Explaining anomalies and ranking likely causes | Precise margin math with no calculation layer |
| Comparing cohorts and customer segments | Live on-site / session behavior |
| Blending numbers with context (returns, reviews, support) | Anything needing an always-fresh feed |
Learn more on how to use Claude AI for data analytics.
The multi-source reality to keep in mind
The second thing to understand has nothing to do with Claude’s math skills, and it’s what determines the accuracy or your reports and insights.
A real store doesn’t run on one source. You’ve got Shopify or WooCommerce for orders, GA4 for traffic and funnel, Google Ads and Meta for spend, Klaviyo for email, maybe Amazon Seller Central on top.
The hard part of AI-powered ecommerce performance analytics isn’t getting one of those into Claude but getting all to agree with each other before Claude ever sees them.
Google Ads and Meta both take credit for the same sale. Currencies and timezones don’t line up. “Revenue” means something different in each tool. Feed that to any AI and it will happily reconcile nothing and answer anyway.
So the range of what you can ask is wide, as long as the data underneath is blended and clean:
| Analysis type | Example question |
|---|---|
| Marketing and paid ads | “Which campaigns are burning spend with no return this week?“ |
| Conversion and funnel | “Where are people dropping off in checkout, mobile vs desktop?“ |
| Retention and LTV | “Which acquisition source brings back the highest-value repeat buyers?“ |
| Operations and inventory | “Which fast-selling SKUs are about to run out of stock?“ |
Claude is the analyst and the interpreter here, not an oracle. Every answer is only as good as the data it reasons over. Which is exactly why the first real question is how you get your data in front of it.
Getting your store data into Claude: your options
This is really what using Claude AI for data analysis in ecommerce comes down to: the connection method decides whether the answers are trustworthy.
| Approach | What it is | The catch |
|---|---|---|
| Spreadsheets / CSV exports | Export from each tool, upload the file | Stale, manual, and big files make the model misread |
| Native connectors, one per platform | Connect each tool to Claude on its own | Claude still sees silos; blended numbers come out wrong |
| A unified data layer | One connector pulls and reconciles every source, then feeds Claude | Needs a data tool, but it’s the only one that scales |
Spreadsheets and CSV exports
This is the manual way: export orders from Shopify, spend from Google Ads, email from Klaviyo, and upload the files into a chat.
It’s fine for a genuine one-off. It falls apart as a habit.
The file is a stale snapshot the second you export it. You’re redoing the pull by hand every time you want a fresh look. And a large export runs straight into the model’s context window limit, so it skims or truncates and you get an answer built on part of your data.
Note: Uploading CSVs to Claude Chat will only give you hallucinated data as it can’t perform calculations. If you want to quickly analyse data from one off exports, use Claude Cowork as it will write code to run the math on the data instead of guessing.
Native Claude connectors, one per platform
Better than files: connect each tool to Claude directly so it can pull live data instead of a frozen export.
The catch is that each connector is independent. You end up with a separate pipe per source, and those pipes don’t reconcile. Currencies and timezones don’t match. Attribution double-counts, because Meta and Google both claim the same order and Claude has to query each source individually.
So when you ask for blended ROAS across channels, Claude is stitching together silos that disagree, and the number it hands back is wrong in a way that’s hard to catch.
A unified data layer
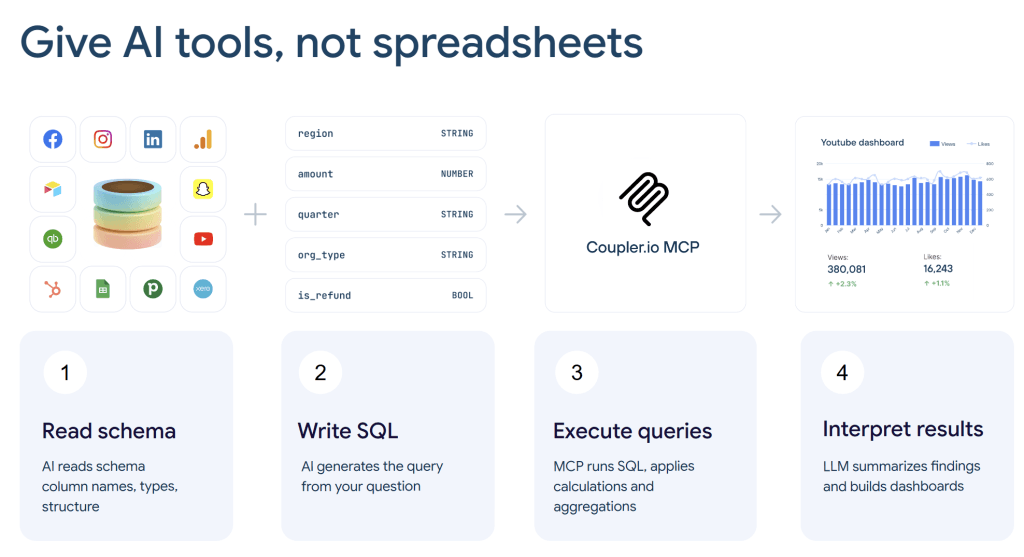
The approach that actually holds up is one connector that pulls every source into a single reconciled layer, blends them on shared keys like date, order ID, UTM, and SKU, and then feeds that clean layer to Claude.
Now Claude sees one coherent view of your business instead of six arguing feeds, so cross-channel questions get answered correctly. You don’t need a connector per source, and you don’t need to reconcile anything by hand.
This is what Coupler.io does: one connector pulls every source into a reconciled layer and feeds that to Claude. Here’s how to set it up.
Blend Shopify, ads, and email for Claude with Coupler.io
Book a demoHow to connect Claude to your ecommerce data with Coupler.io
Coupler.io provides over 400 Claude integrations for ecommerce performance analysis. The connection requires no coding or technical skills whatsoever. You can combine data from multiple sources, add business context to your data sets, and schedule data refreshes.
A note on security before you connect anything
If you’re handling customer purchase data, the PII question is fair. Here’s how Coupler.io handles security for your data:
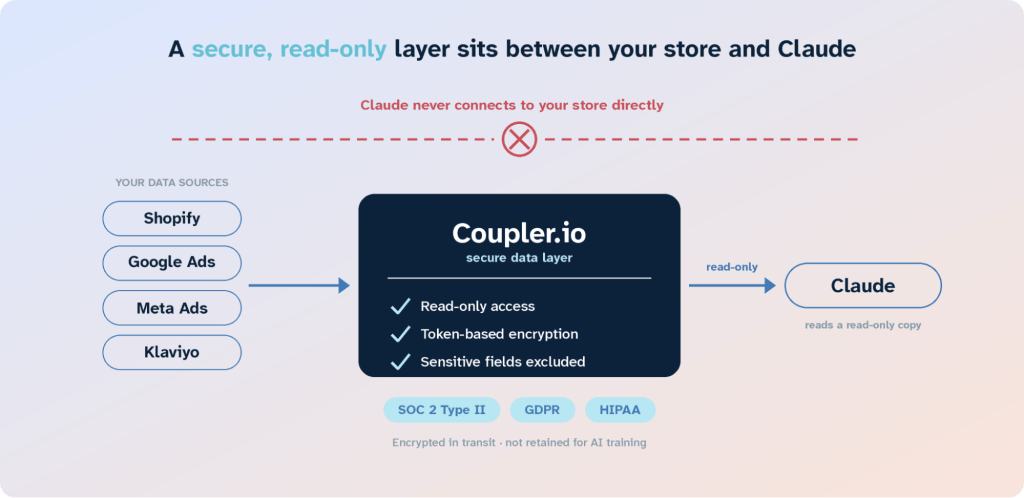
The data layer is read-only: Claude reads a reconciled copy of your data and never connects to your Shopify, ad, or email accounts directly. Access runs through token-based encryption, and Coupler.io is SOC 2 Type II compliant and supports GDPR and HIPAA requirements. The AI tool never touches your source systems, and you can exclude sensitive customer fields before anything reaches the model.
You’re not wiring Claude into your live store; you’re giving it a controlled, read-only window onto clean data.
Send your data straight to Claude
When to use: Best when you mainly want conversational analysis and don’t need long history or a separate dashboard.
How it works:
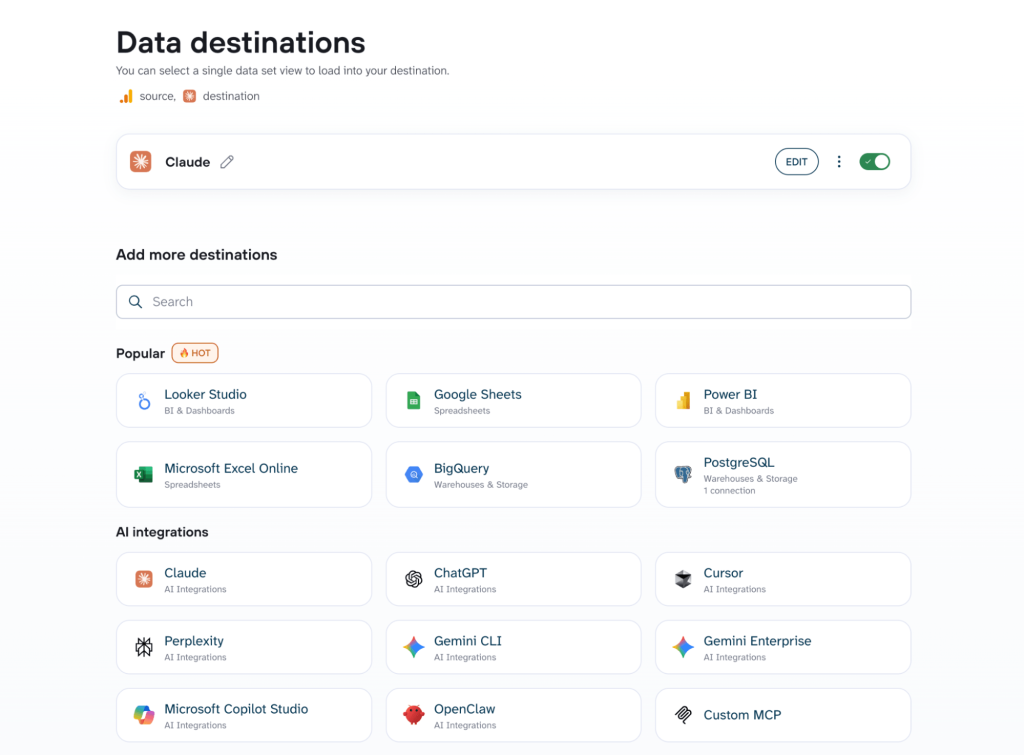
Coupler.io delivers the blended data with Claude set as a destination, refreshed on the schedule you pick, so you’re asking questions on fresh data instead of a stale export. This connection runs over Coupler.io’s MCP server (the Model Context Protocol) and ensures data arrives with structure, context, refresh, and calculations already handled.
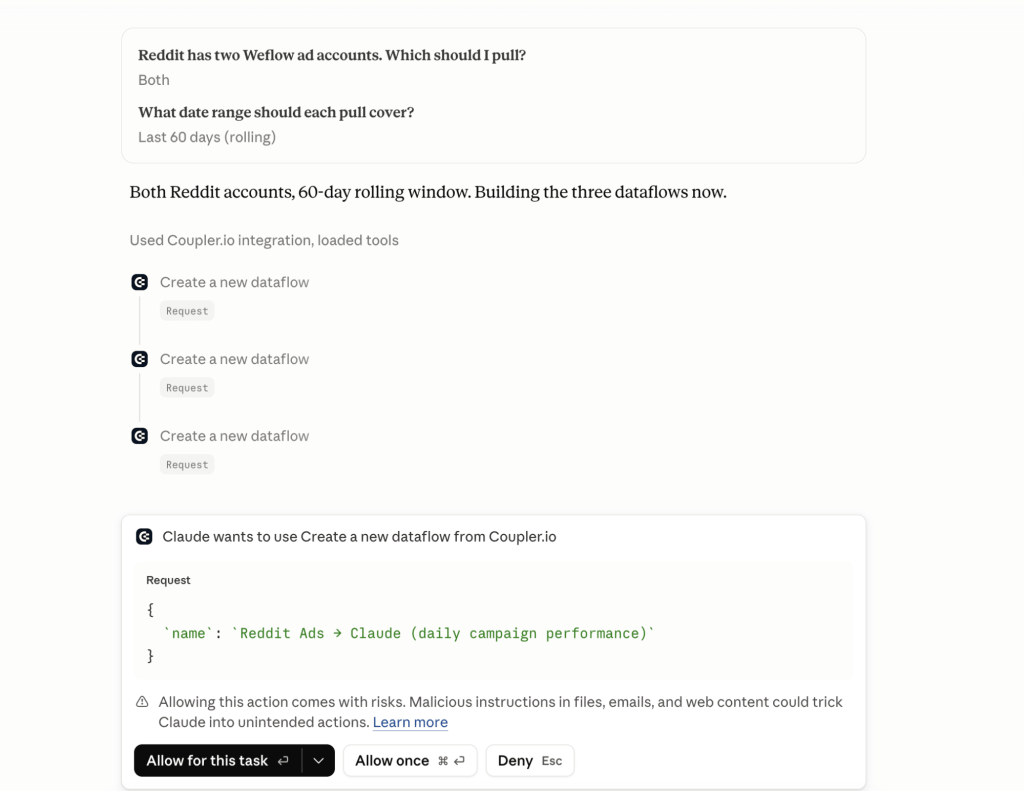
You can also trigger the setup from inside Claude itself: with the Coupler.io connector installed, you can ask Claude to set up the data flows you need without leaving the chat.
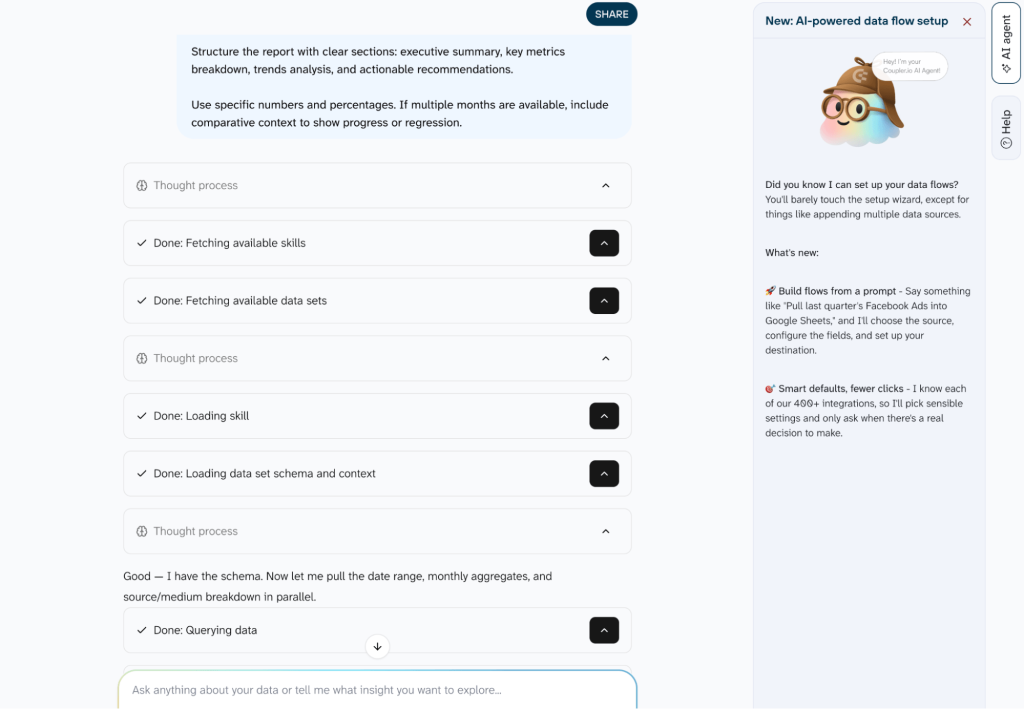
And if you’d rather stay in one place entirely, Coupler.io’s built-in AI Agent lets you query the same synced data in plain language without opening an external AI tool.
Send your data to a warehouse like BigQuery first
When to use: Best when you’re handling large volume of data and need to retain a history longer than what native analytics platforms give you (GSC for example stores your data for 16 months only)
Coupler.io loads every source into a warehouse like BigQuery on a schedule, then Claude reads from the warehouse using SQL queries.
You don’t need to learn SQL or understand how to configure BigQuery. Claude can guide you into setting up an account in a few steps and once your data is synced in there through Coupler.io data flows, it will translate your plain language questions into SQL queries to get the answers from the data.
You own the data, you keep a full history, and you can run complex analysis.
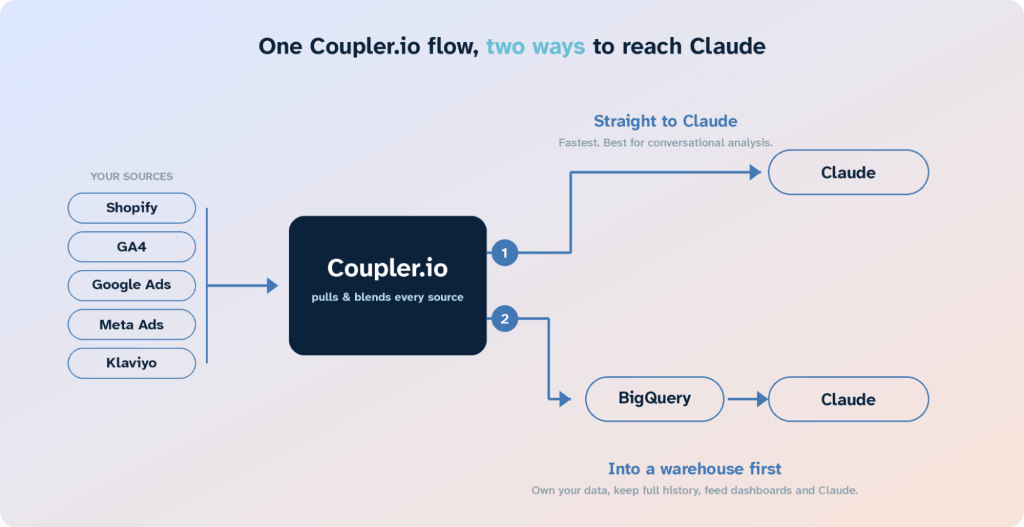
Note: One Coupler.io flow can feed several destinations at once, the same prepared data can land in the warehouse, a Google Sheets report, a Looker Studio dashboard, and Claude on a single refresh Connect once, and the dashboard your team opens and the answers Claude gives are reading from the same numbers.
Get ecommerce answers you can trust in Claude with Coupler.io
Get started for freeHow to keep ecommerce data analysis with Claude accurate
Connecting the data cleanly is half the job. The other half is making sure Claude doesn’t invent a number or misread a column. It comes down to three layers.
Calculations run outside the model
An LLM predicts text, it doesn’t compute. Ask it for “total revenue by channel” over thousands of rows and it writes a plausible-looking total, sometimes right, sometimes not, always confident.
Coupler.io’s Analytical Engine fixes this by splitting the work.
You ask in plain language, Claude turns it into a SQL query, the Analytical Engine runs that query against your full dataset, does the math, validates it, and hands Claude back only the verified result to explain.
Think of it as the mathematician and the storyteller: the engine computes ROAS, CAC, and margin correctly, and Claude explains what they mean.
Gabe Solberg, a B2B performance marketer running over $1M a month in Meta ad spend, connected his ad data to Claude through Coupler.io for daily health checks and end-of-month forecasts.
I’m not getting AI’s best guess. Coupler.io does the actual math. Claude just helps me ask the right questions and understand the results.
The payoff was about 60% less time on reporting, on numbers he doesn’t rebuild in a spreadsheet to trust.
Claude learns your data’s structure
Even with the math handled, Claude can still misread what your columns mean.
“Revenue” might include refunds in one system and exclude them in another. “Orders” might or might not count cancellations. Guess wrong and the total is technically correct but answers the wrong question.
That’s what the schema prevents.
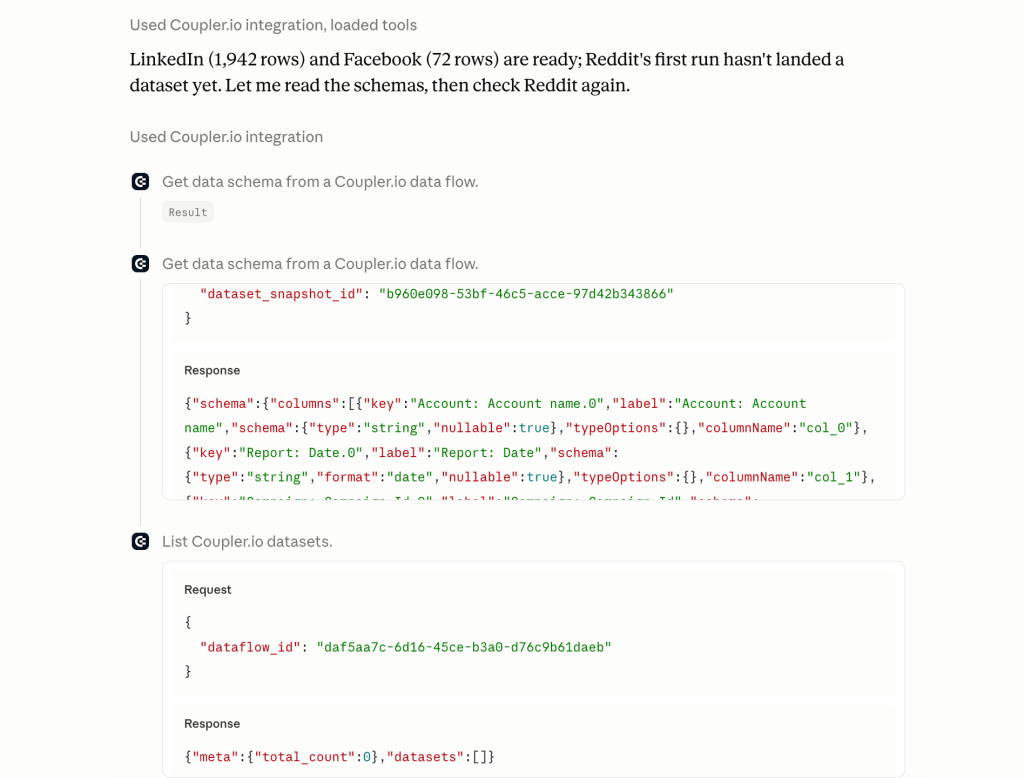
Before any analysis, Coupler.io passes Claude the schema: column names, data types, and a sample of rows, not the full dataset. So Claude knows revenue is net of tax, that financial_status separates paid from refunded, which column is the SKU. It reads the shape of your data instead of guessing from a header, and the dataset’s size never becomes the problem.
Claude learns your business context
Most wrong-sounding answers aren’t bad math. They’re missing context.
If you doubled budget on one channel and paused another, ran a promo in two countries only, or shipped a checkout redesign, Claude needs to know, or it might interpret a deliberate decision as a problem.
Coupler.io lived this one. The team changed their lead scoring model on purpose, so scheduled calls dropped as intended. The AI looked at the funnel and flagged a “massive acquisition problem.” It was right about the data and wrong about the meaning, because nobody told it the scoring had changed. A human checking the same dashboard made the identical wrong call.
The sharper version is what the team calls ghost signups: signups climbing while activation fell, which reads as a crisis. But those extra signups matched four conditions at once (source “Google,” no country or IP, no GA4 attribution, and “N/A” in a field a real person can’t select), so they were bots. Filter them out and activation had been flat all along.
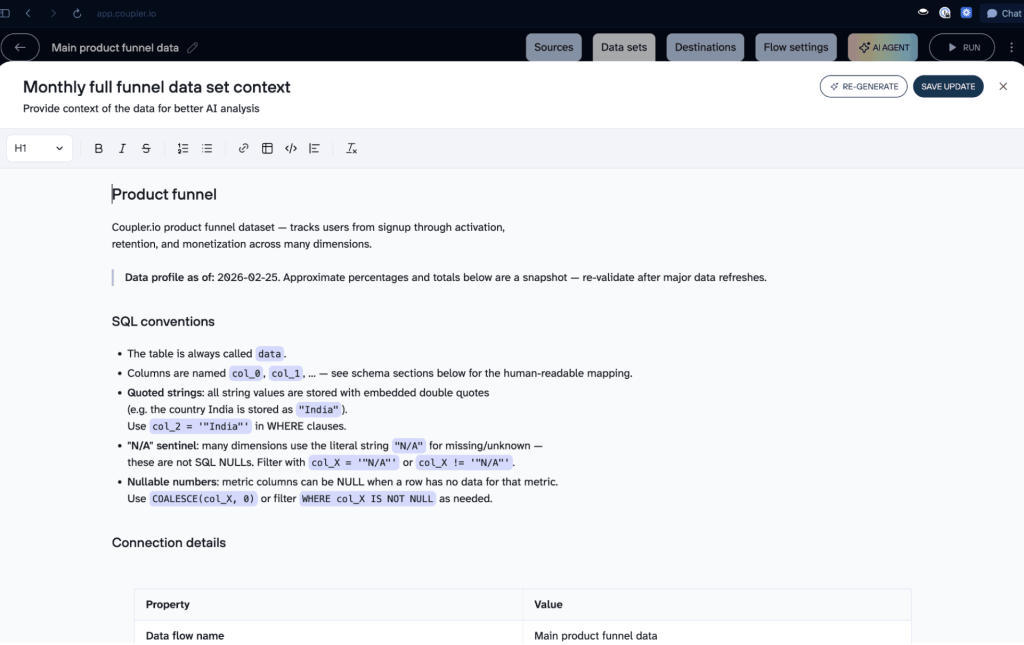
The fix is an event log the AI can read: a plain record of what you changed and when. It can live as a file in a Claude Project, a log table in a database or as Coupler.io’s data set context that every query inherits automatically, so you don’t re-explain your business in every chat.
Run cross-channel attribution and LTV in Claude with Coupler.io
Sign up for freeAutomating recurring analysis: skills and projects
Once you’ve asked a good question once, you don’t want to rebuild it from scratch next week. This is how you automate ecommerce analytics with Claude: two building blocks that make an analysis repeatable and context-aware.
Structured data gets you correct answers; skills and projects get you the same correct answer every time without the setup tax.
Skills: your analysis, codified
Claude Skills are instruction files you can edit and improve over time. They contain details on when to activate, the steps to follow, which tools to call, and the output format.
Claude even has a Skill for building a skill, you just have to ask for help with documenting your process and help you build your own skill and it will trigger it, just make sure it’s enabled in your account.
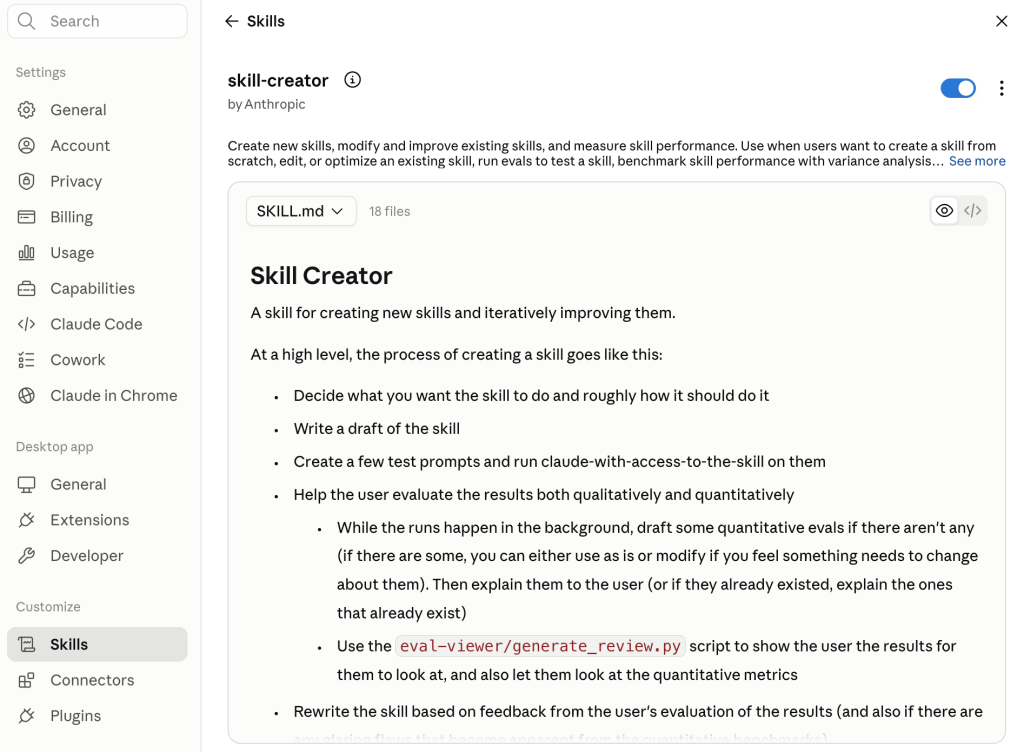
You can also copy and customize skills built and shared by others so you don’t start from scratch.
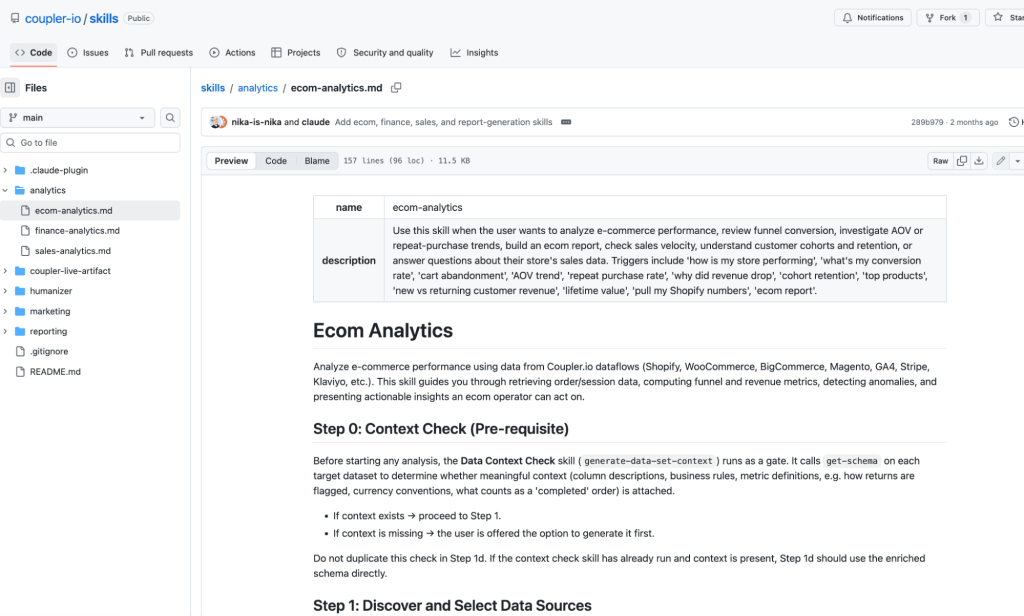
For example, Coupler.io has an open-source ecom-analytics skill (on GitHub) that hands Claude a full ecommerce-analyst playbook: funnel analysis, AOV, cohort retention, and anomaly detection, all defined the way an analyst would run them. It works across Shopify, WooCommerce, GA4, Klaviyo, Stripe, and more.
You can use it as-is, edit it, or build your own with a self-improving feedback log so it gets sharper each time you correct it.
Projects: context that sticks
A Claude Project holds your brand brain: your benchmarks, metric definitions, and the decision log from the accuracy section, so every new chat already knows your business. Set it up once and you stop re-explaining what “good” looks like. It pairs directly with the data set context from the previous section: the Project carries the qualitative context, the data layer carries the schema and numbers.
Where you run it: Chat, Cowork, or Code
Claude Chat gives you answers and data visualizations (Artifacts) on demand. Cowork adds schedules, versioned reports, and live artifacts that refresh on click, and Claude Code is for full automation and AI agents, and it’s the most setup, so most stores live in Chat and Cowork.
| Surface | Best for | Skills & Projects | Getting the math right |
|---|---|---|---|
| Claude Chat | Ad-hoc questions, right now | Yes, both | Doesn’t compute on its own, it predicts totals. Coupler.io’s Analytical Engine supplies the real numbers |
| Claude Cowork | Scheduled, hands-off analysis | Yes, both, plus scheduling | Can write and run code to calculate, but it’s only as good as the data. Coupler.io keeps it structured and reconciled |
| Claude Code | Full automation and custom agents | Skills yes; project context lives in repo files | Runs code and computes, but it’s garbage in, garbage out without Coupler.io’s reconciled data |
How ecommerce businesses can use Claude for performance analytics
A quick “give me a 7-day summary across channels: revenue, orders, spend, ROAS, CAC, and flag anything that moved” is the easy entry point for your first ecommerce analysis with Claude.
Below, you can see use cases of using Claude for ecommerce analytics with Coupler.io as a drivetrain for your ecommerce data pipelines.
Cross-channel attribution reconciliation
Data sources: Google Ads, Meta Ads, and Shopify orders (add GA4 if you want the session-level path to purchase).
Destination: Claude directly. You run this the moment you spot a discrepancy in your numbers, so conversational analysis beats building a dashboard for it.
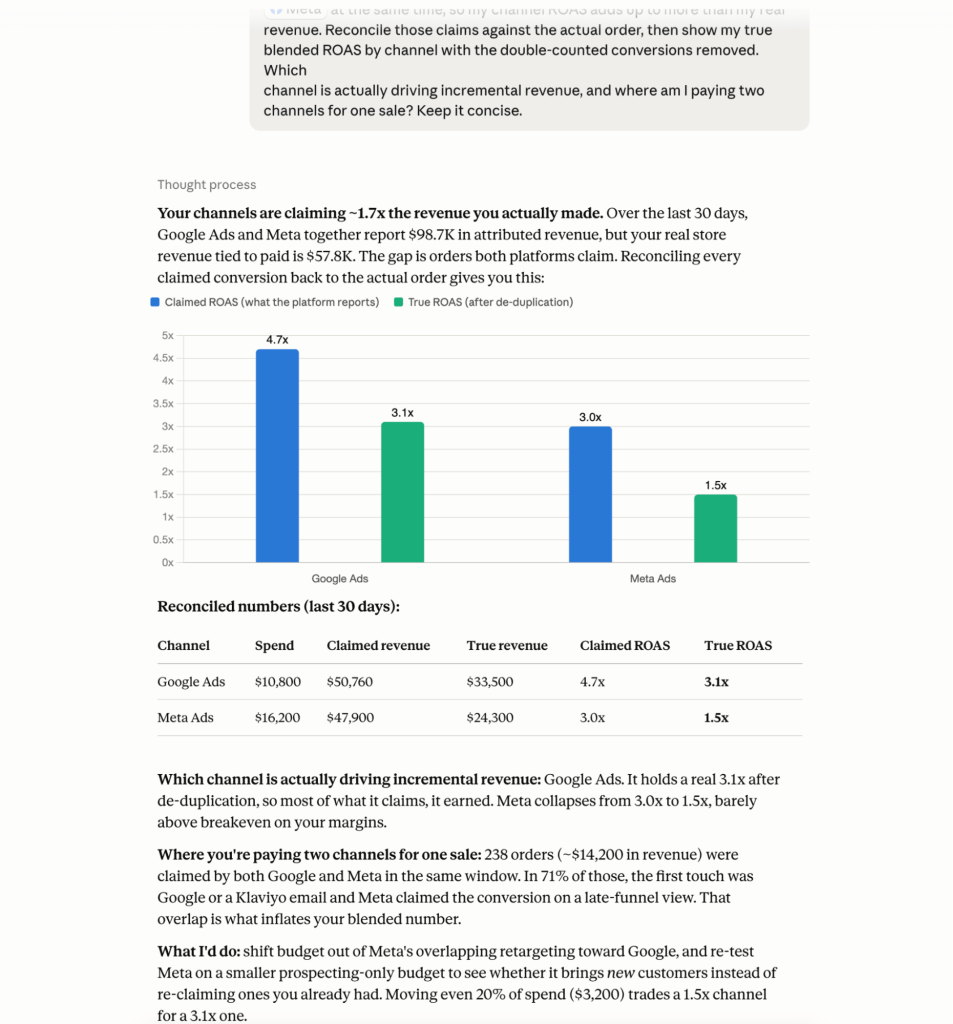
Scope: Any ecommerce store running paid on more than one channel hits this: Google Ads and Meta each report the same Shopify sale as their own, so your channel-level ROAS quietly adds up to more revenue than the store actually made. With all three sources blended and sitting in Claude, you can reconcile both platforms’ claims against the single real order and see the true split.
What you get: When you connect Shopify to Claude, you’ll get true blended ROAS for each channel, a straight answer on which channel actually drove the incremental sale, and the specific orders where you’re paying both Google and Meta for one purchase. Instead of trusting each platform’s self-credit, you know exactly where to cut the double-counted ad spend, and Claude explains the reconciliation in plain language so you can act on it the same morning.
Prompt:
Look at my ecommerce data. Some orders are claimed by both Google Ads and Meta at the same time, so my channel ROAS adds up to more than my real revenue. Reconcile those claims against the actual order, then show my true blended ROAS by channel with the double-counted conversions removed. Which channel is actually driving incremental revenue, and where am I paying two channels for one sale? Keep it concise.
Inventory-informed ad spend decisions
Data sources: Shopify (inventory levels and sell-through), Google Ads and Meta Ads (ad performance).
Destination: Claude directly for the weekly decision, plus an optional Looker Studio dashboard to keep an eye on stock-vs-spend between checks.
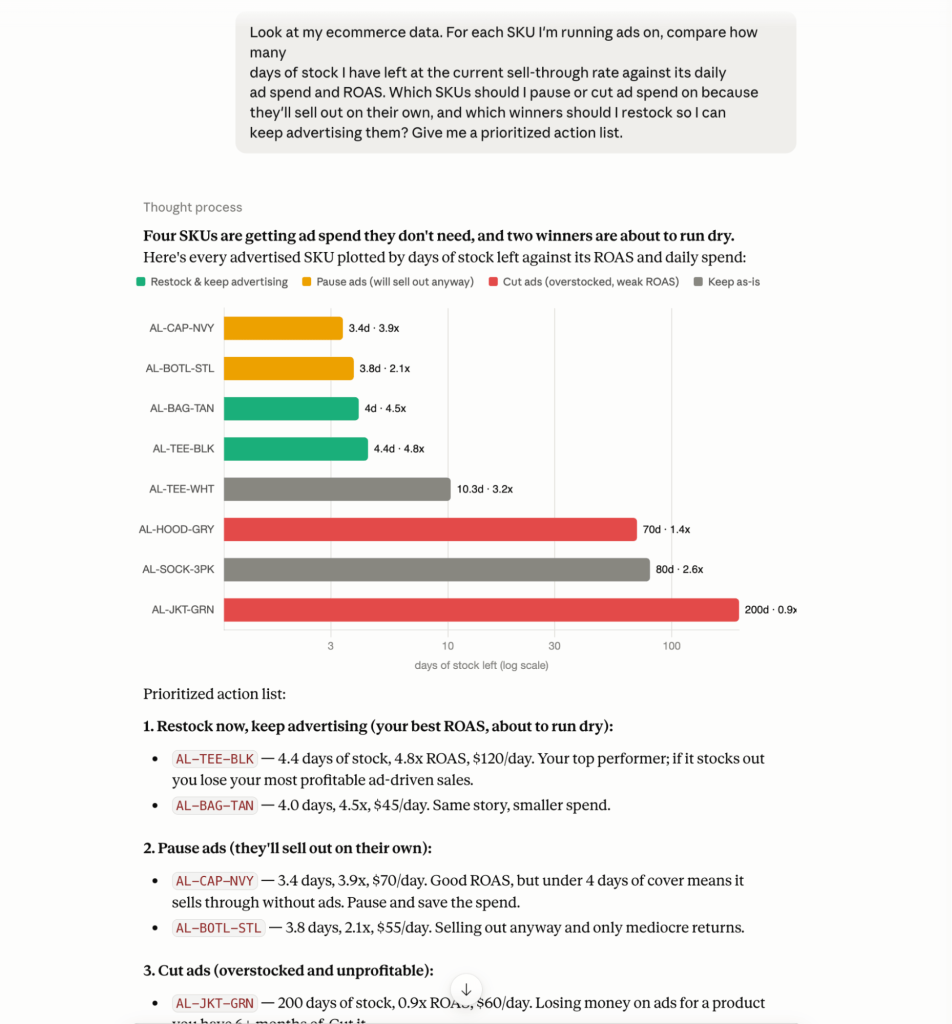
Scope: In most ecommerce stores, ad spend and inventory levels live in separate tools and separate teams, so you keep paying to advertise SKUs that are about to sell out or already have. With stock, sell-through, and ad performance blended in Claude, every spend decision can account for how many days of inventory are actually left.
What you get: With this data in Claude, you’ll get a prioritized list of which SKUs to pause or cut ad spend on because they’ll sell through on their own, and which winners are worth restocking so you can keep advertising them. You stop burning budget promoting products you can’t ship, and you catch the fast sellers before they stock out mid-campaign.
Prompt example:
Look at my ecommerce data. For each SKU I'm running ads on, compare how many days of stock I have left at the current sell-through rate against its daily ad spend and ROAS. Which SKUs should I pause or cut ad spend on because they'll sell out on their own, and which winners should I restock so I can keep advertising them? Give me a prioritized action list.
Post-promotion true-impact analysis
Data sources: Shopify orders, discount codes, and returns/refunds.
Destination: Claude directly. This is a one-off you run after a promo wraps, and Coupler.io’s Analytical Engine handles the multi-step math behind the net number.
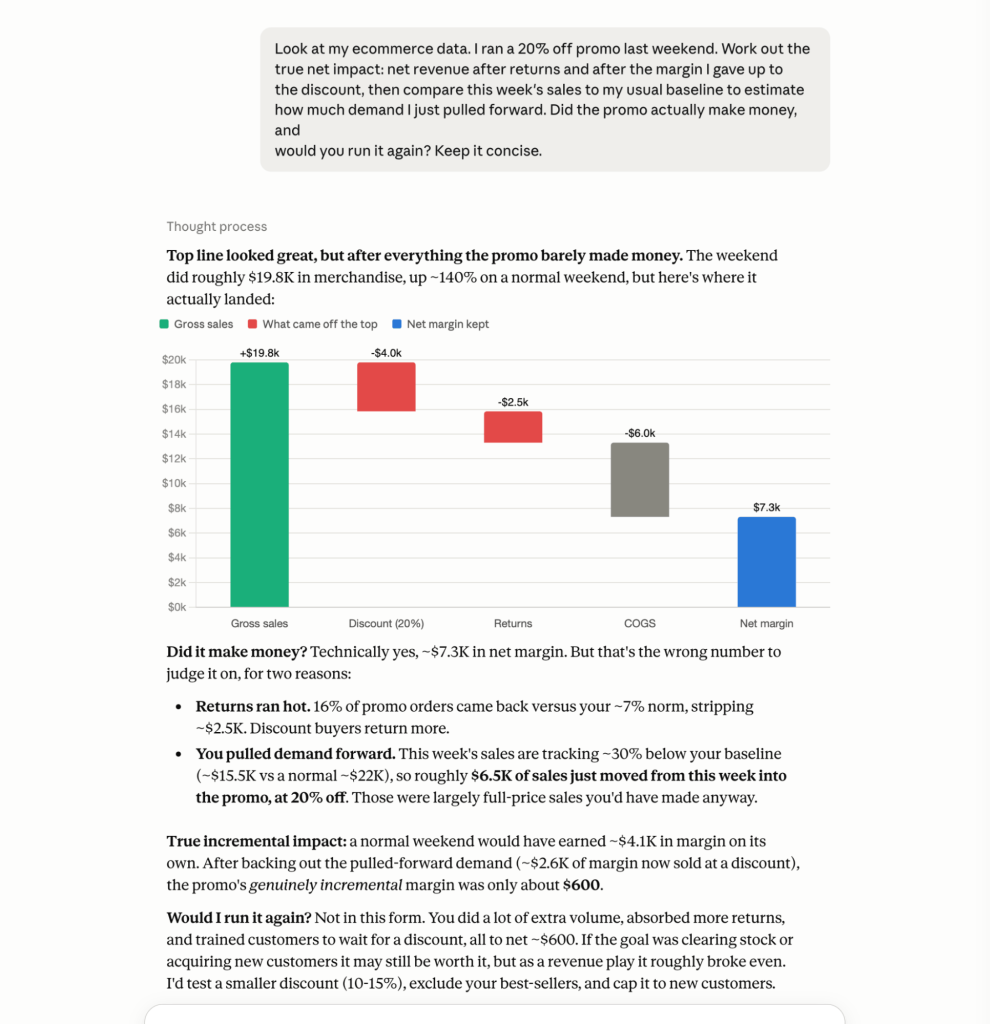
Scope: You ran a 20% off weekend and the top-line looks great, but for an ecommerce store the headline revenue hides the margin you gave up to the discount, the returns still trickling in, and the sales you pulled forward from next week. With orders, discounts, and returns blended in Claude, you can net the promo out and compare the following week against your baseline.
What you get: Load data via the Shopify MCP to Claude and get the promo’s true net impact after margin erosion and returns, plus an estimate of how much demand you simply pulled forward instead of created. You’ll know whether the sale actually made money and whether it’s worth repeating, instead of celebrating a top-line number that quietly lost margin.
Prompt example:
Look at my ecommerce data. I ran a 20% off promo last weekend. Work out the true net impact: net revenue after returns and after the margin I gave up to the discount, then compare this week's sales to my usual baseline to estimate how much demand I just pulled forward. Did the promo actually make money, and would you run it again? Keep it concise.
Anomaly investigation
Data sources: Shopify, GA4, your ad platforms, and Klaviyo.
Destination: Claude directly when you need to investigate now, or a scheduled Claude Cowork check that flags the drop before you even notice it.
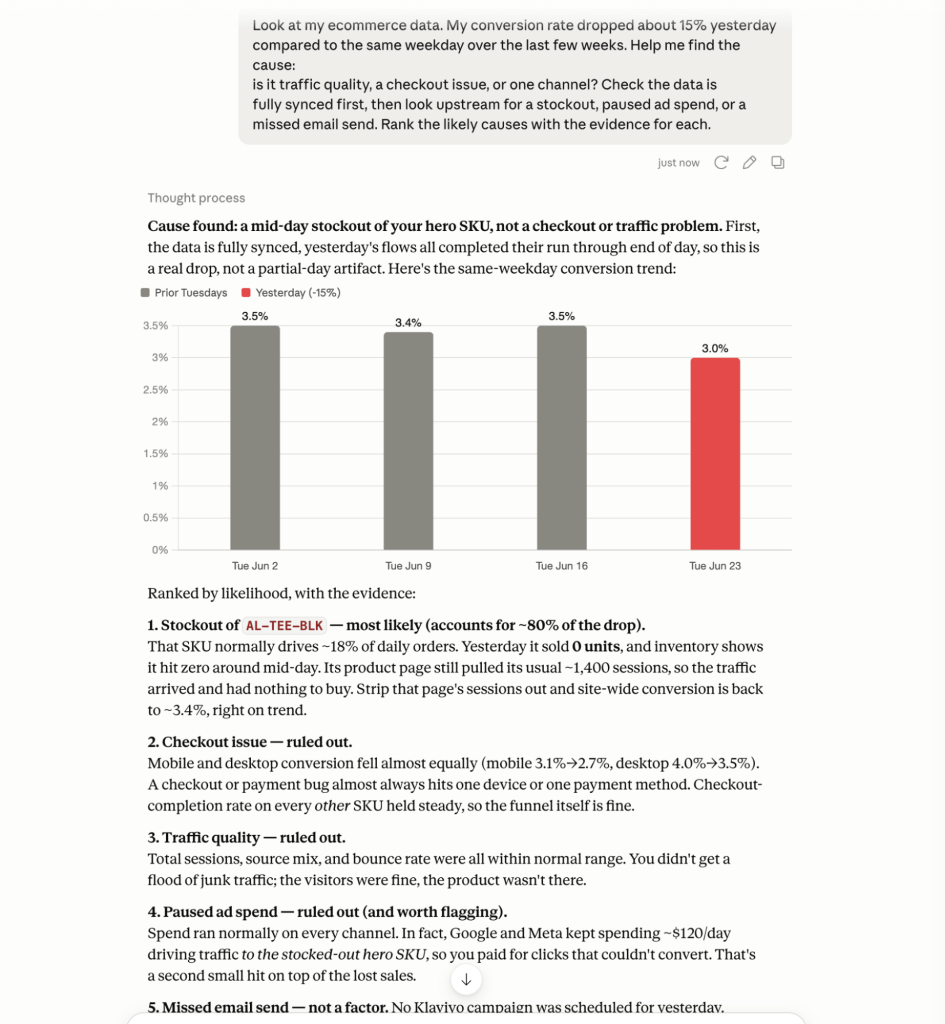
Scope: Conversion rate drops 15% overnight and, in ecommerce, the cause could be almost anything: traffic quality, a checkout bug, one channel, a stockout, paused ad spend, or a missed email send. With every source blended in Claude, it runs the root-cause method for you: isolate the scope, check data freshness first (a partial-day sync faking a drop is the most common false alarm), then work upstream. Here’s one from my own reporting.
What you get: With this data in Claude, you’ll get a ranked list of the likely causes with the evidence behind each, and the false alarms ruled out first. Instead of spending the morning bouncing between GA4, Shopify, and your ad dashboards, you get pointed straight at the real problem while it’s still cheap to fix.
Prompt example:
Look at my ecommerce data. My conversion rate dropped about 15% yesterday compared to the same weekday over the last few weeks. Help me find the cause: is it traffic quality, a checkout issue, or one channel? Check the data is fully synced first, then look upstream for a stockout, paused ad spend, or a missed email send. Rank the likely causes with the evidence for each.
Retention and LTV by acquisition source
Data sources: Shopify orders and customers, Klaviyo email engagement.
Destination: BigQuery first, then Claude reads from it. Cohorts and lifetime value need a long history that native platforms don’t keep, so the warehouse is worth it here.
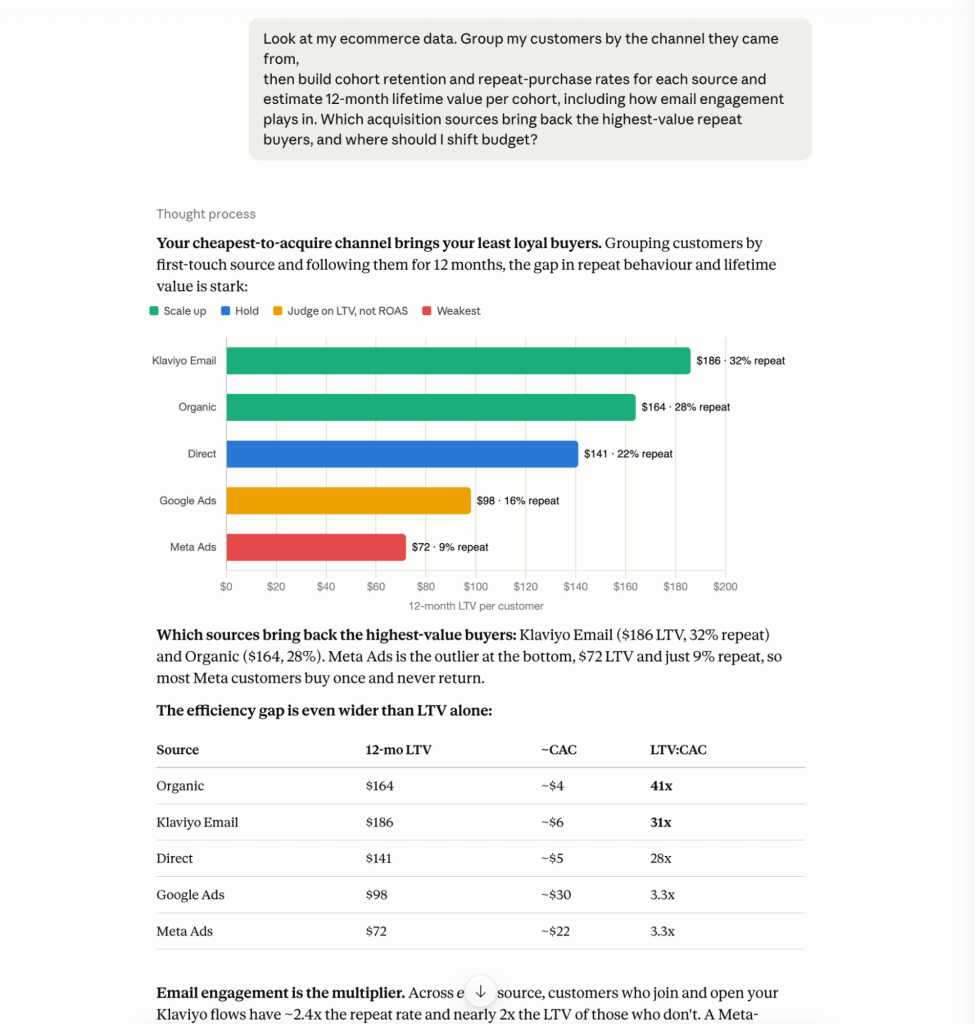
Scope: Most ecommerce teams optimize acquisition on CAC and chase the cheapest clicks, with no idea which sources bring back buyers who stick and spend again. With order history, customers, and Klaviyo blended in a warehouse Claude reads from, you can build real cohort retention and repeat-purchase curves by acquisition source instead of guessing.
What you get: With this data in Claude, you’ll get a clear view of which acquisition sources produce the highest-LTV, highest-retention customers rather than just the cheapest first order, and where to move budget as a result. That’s how you improve ecommerce performance with Claude: by spending where the lifetime value is, not where the click is cheap.
Prompt example:
Look at my ecommerce data. Group my customers by the channel they came from,then build cohort retention and repeat-purchase rates for each source and estimate 12-month lifetime value per cohort, including how email engagement plays in. Which acquisition sources bring back the highest-value repeat buyers, and where should I shift budget?
Analyze your ecommerce data in Claude with Coupler.io
Book a demoFAQs
Is my customer data safe when I use Claude for ecommerce analysis?
Yes, when it goes through a secure middle layer. Claude reads a read-only copy of your data and never connects to your store, ad, or email accounts directly. Coupler.io is SOC 2 Type II compliant and supports GDPR and HIPAA, the channel is encrypted, and you can exclude sensitive fields before anything reaches the model. Data sent for analysis isn’t retained by Anthropic for training, and Claude has its own guardrails from Anthropic’s constitutional AI approach.
Can Claude connect directly to my Shopify store?
Not in a way you’d want to rely on for analytics. Claude needs a data layer between it and Shopify, both to keep the connection read-only and because real analysis means blending Shopify with your ad, email, and analytics data, not reading Shopify alone.
Do I need to know SQL or code to analyse my ecommerce data with Claude?
No. You ask in plain language, and the SQL or JavaScript needed to query and calculate runs under the hood. You get analyst-grade answers without being an analyst or an engineer.
Can Claude build charts from my store data?
Yes. Claude returns Artifacts, which are live data visualizations (charts and tables) you can read and reuse, not just text. “Show me revenue by channel this month” comes back as a visual you can put in front of your team.
Which Claude plan do I need for ecommerce analytics: Pro, Max, or Cowork?
Chat-based analysis works on Claude Pro, running on a capable model like Claude Opus 4.6. Step up to Claude Max for heavier usage, and use Claude Cowork when you want scheduled, hands-off reports. Start on Pro and upgrade when your usage or automation needs grow.
How much does this cost?
A working setup starts under $50 a month: Claude Pro from $20/month and Coupler.io from $24/month. You can prove the whole workflow on entry tiers before committing to more.
Can I use this with platforms other than Shopify?
Yes. The same setup works with WooCommerce, BigCommerce, Magento, Amazon Seller Central, and more, since Coupler.io connects 400+ sources. Shopify is just the most common example.
Does this only work with Claude?
No. The same Coupler.io data layer feeds ChatGPT, Gemini, Perplexity, and other AI tools too. The unified layer is platform-agnostic, so you’re not locked into one model.