Your Facebook Ads campaigns are live, generating clicks and even leads. It sounds great, but how can you be sure these results justify your ad spend? Facebook Ads reporting can provide that insight. Reports allow you to analyze campaign performance, evaluate return on investment, and more.
Facebook Ads reports – what are the options?
As a rule, there are two approaches to reporting: native and custom.
Native means that you use the built-in functionalities of the advertising platform. Facebook Ads Manager provides a tool for ad reporting where you can create reports using one of the three layouts: pivot table, trend, and bar. It also allows you to share reports with the users in or outside your ad account, as well as export them in different formats, including Excel.
The custom approach means that users operate tailor-made reports outside of Facebook Ads. Such reporting solutions can be designed in a spreadsheet app like Google Sheets or a BI tool like Looker Studio. How do you have such reports? You can build them yourself using white-label templates or dedicated Facebook Ads reporting tools. The former is easier since you only need to load your data from Facebook Ads. The latter will require more effort depending on the chosen tool and your reporting requirements.
Custom ready-to-use templates for Facebook Ads reporting
First, let’s explore the most actionable way to launch Facebook Ads reporting with not much investment – report templates. They differ by the tool of origin, for example, Tableau, Power BI, Looker Studio. Another essential selection criterion is connectivity, i.e. how easily you can load data from Facebook Ads. Below you will find a few Facebook Ads dashboard templates equipped with a Coupler.io connector that automates data load to your report.
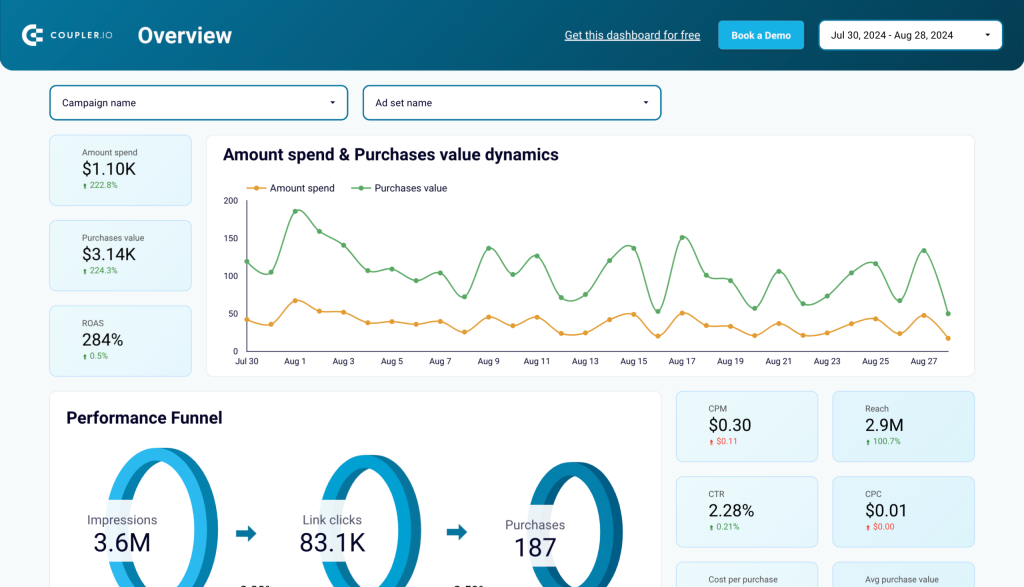
Facebook Ads dashboard template
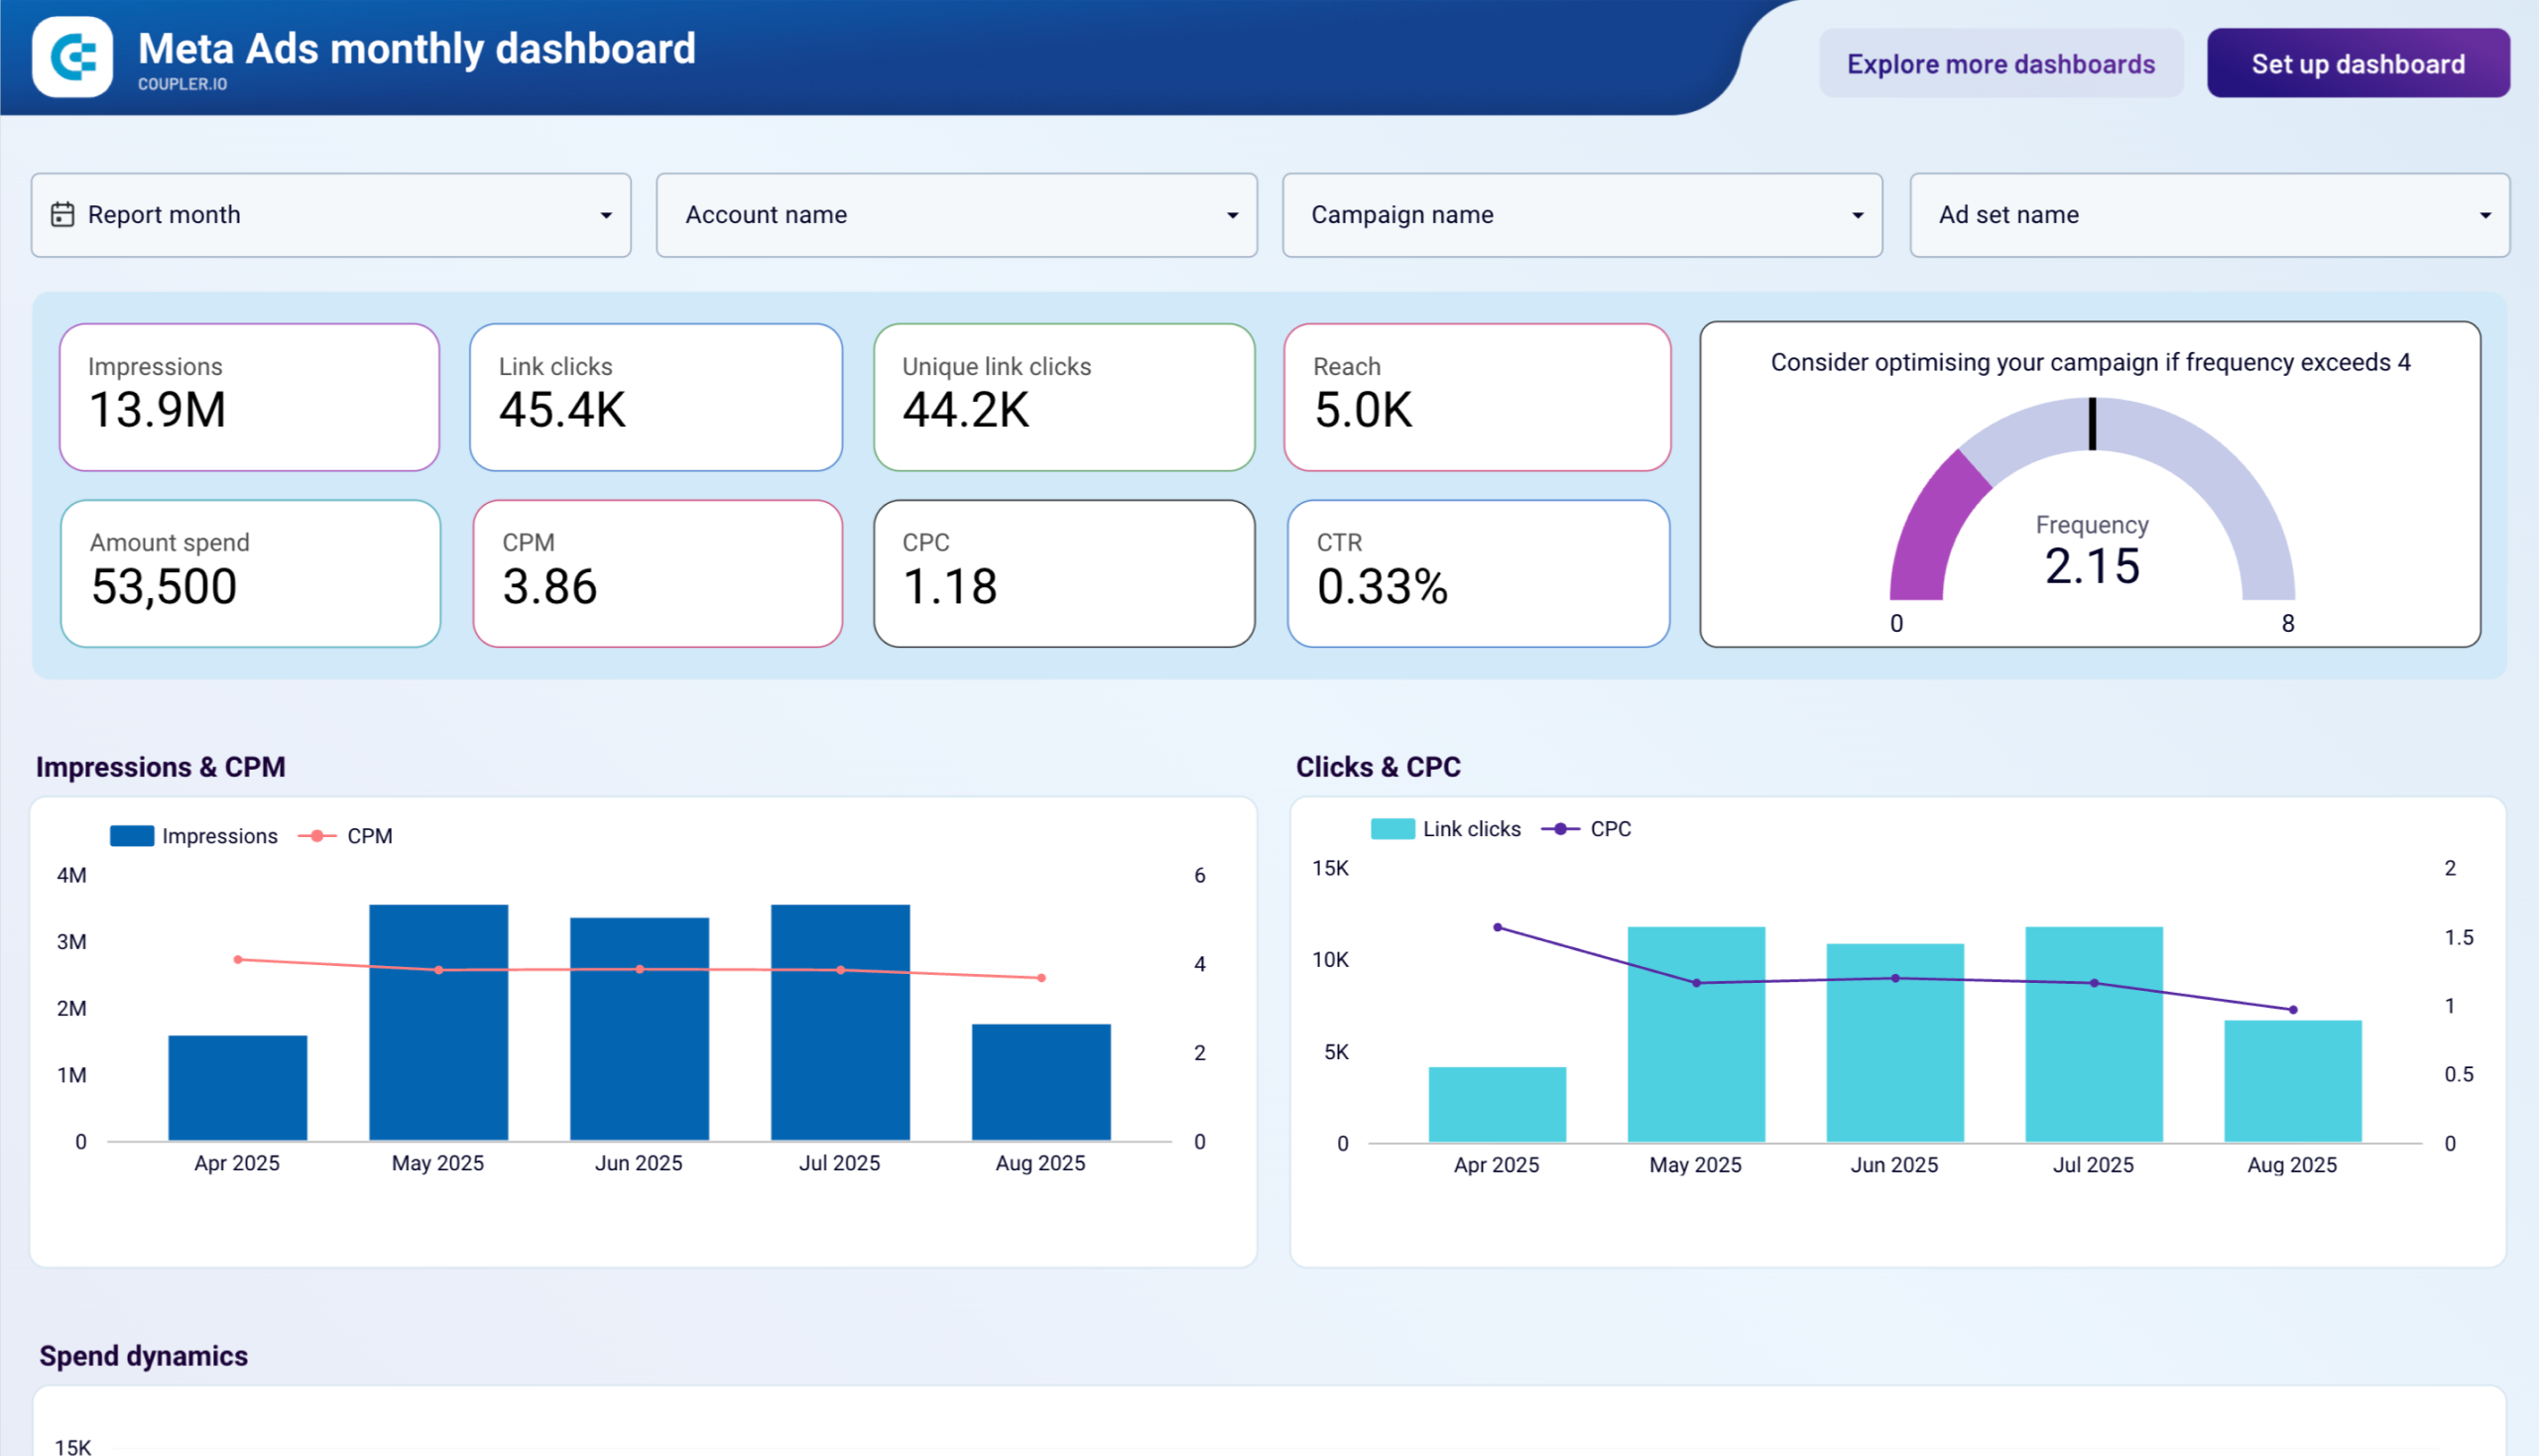
This report offers a complete performance overview of your digital advertising campaigns on Facebook. You can track essential data from clicks to conversions and derive valuable insights.
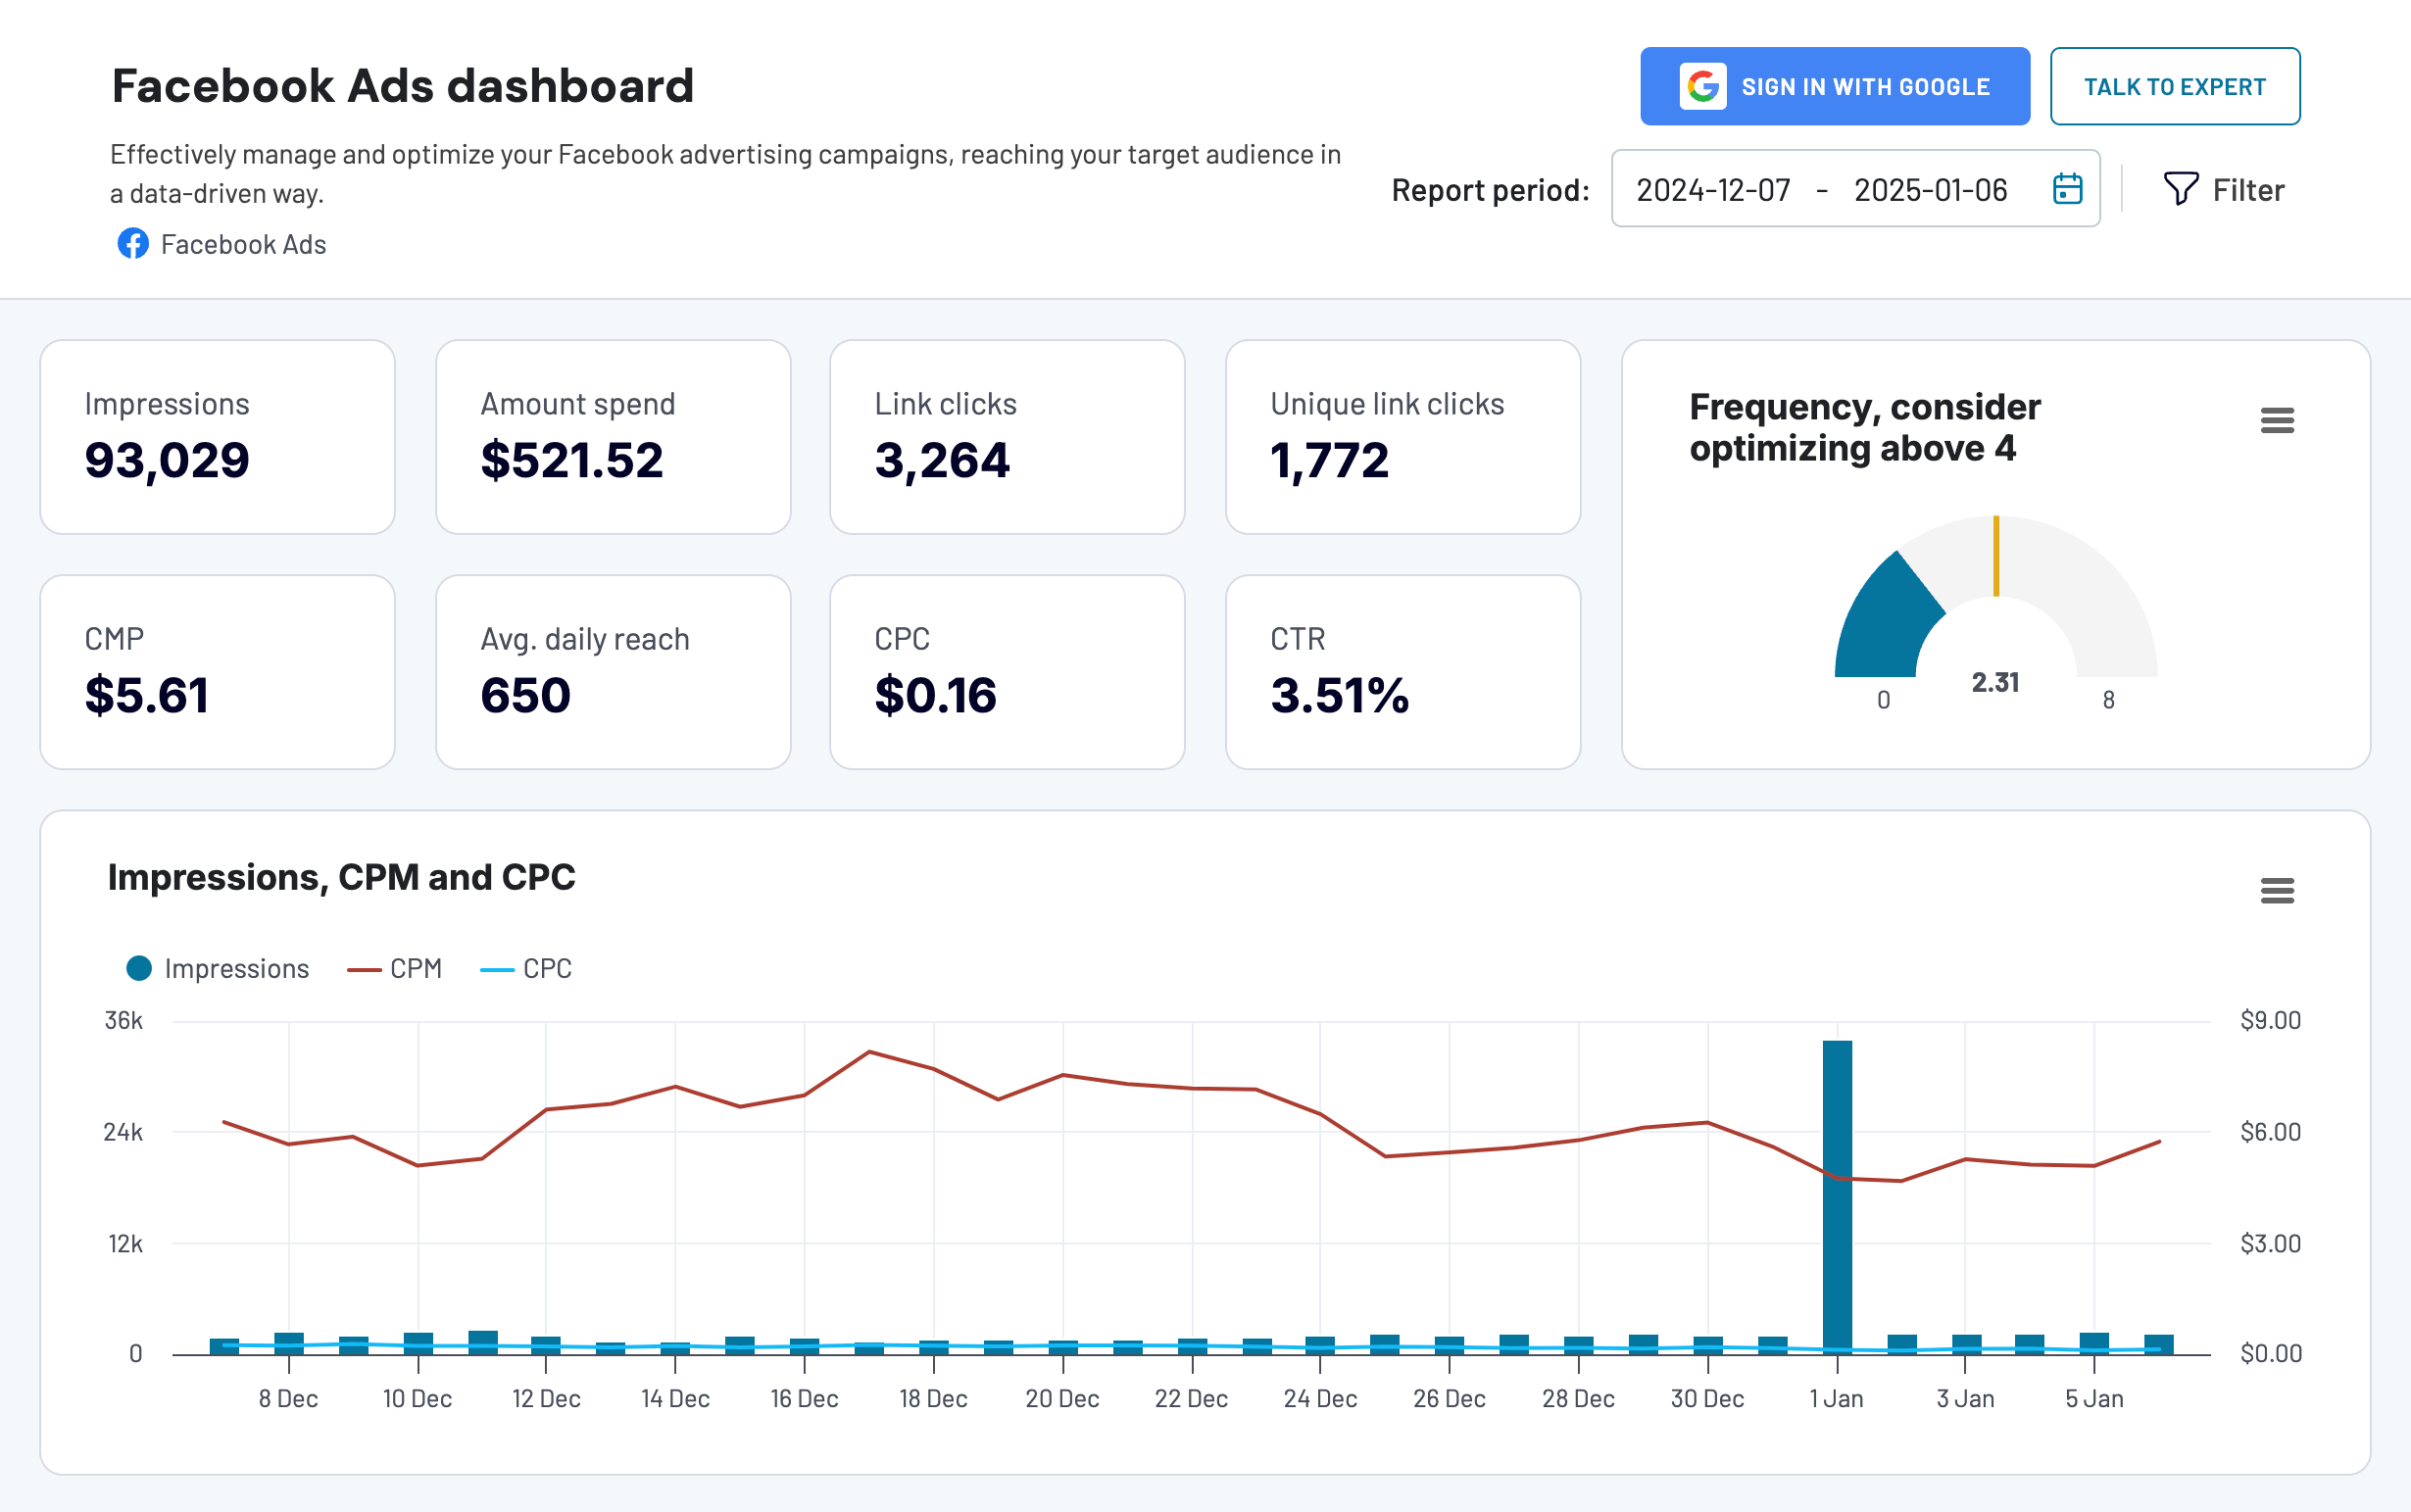
You can easily connect your Facebook Ads account and instantly populate the dashboard with your data. with the built-in Coupler.io connector. And it’s absolutely free of charge.
Key features of the dashboard template
- Frequency meter: Optimize engagement by keeping track of how often users see your ads.
- Clicks by demographics: Instantly see which audience segments are engaging most through a visual bar chart.
- Monthly dynamics: Track key performance metrics over time to gauge your campaigns’ progress.
- Country breakdown: Identify where your traffic is coming from and fine-tune your strategy for different regions.
The Facebook Ads dashboard is also available as a template for external BI tools. You can start using it right away without any hassle. All you need to do is connect your Facebook Ads data to your dashboard copy in either Google Sheets, Looker Studio, or Power BI. Follow the instructions in the setup guide to establish the connection and get a ready-to-go Facebook Ads reporting solution right away.
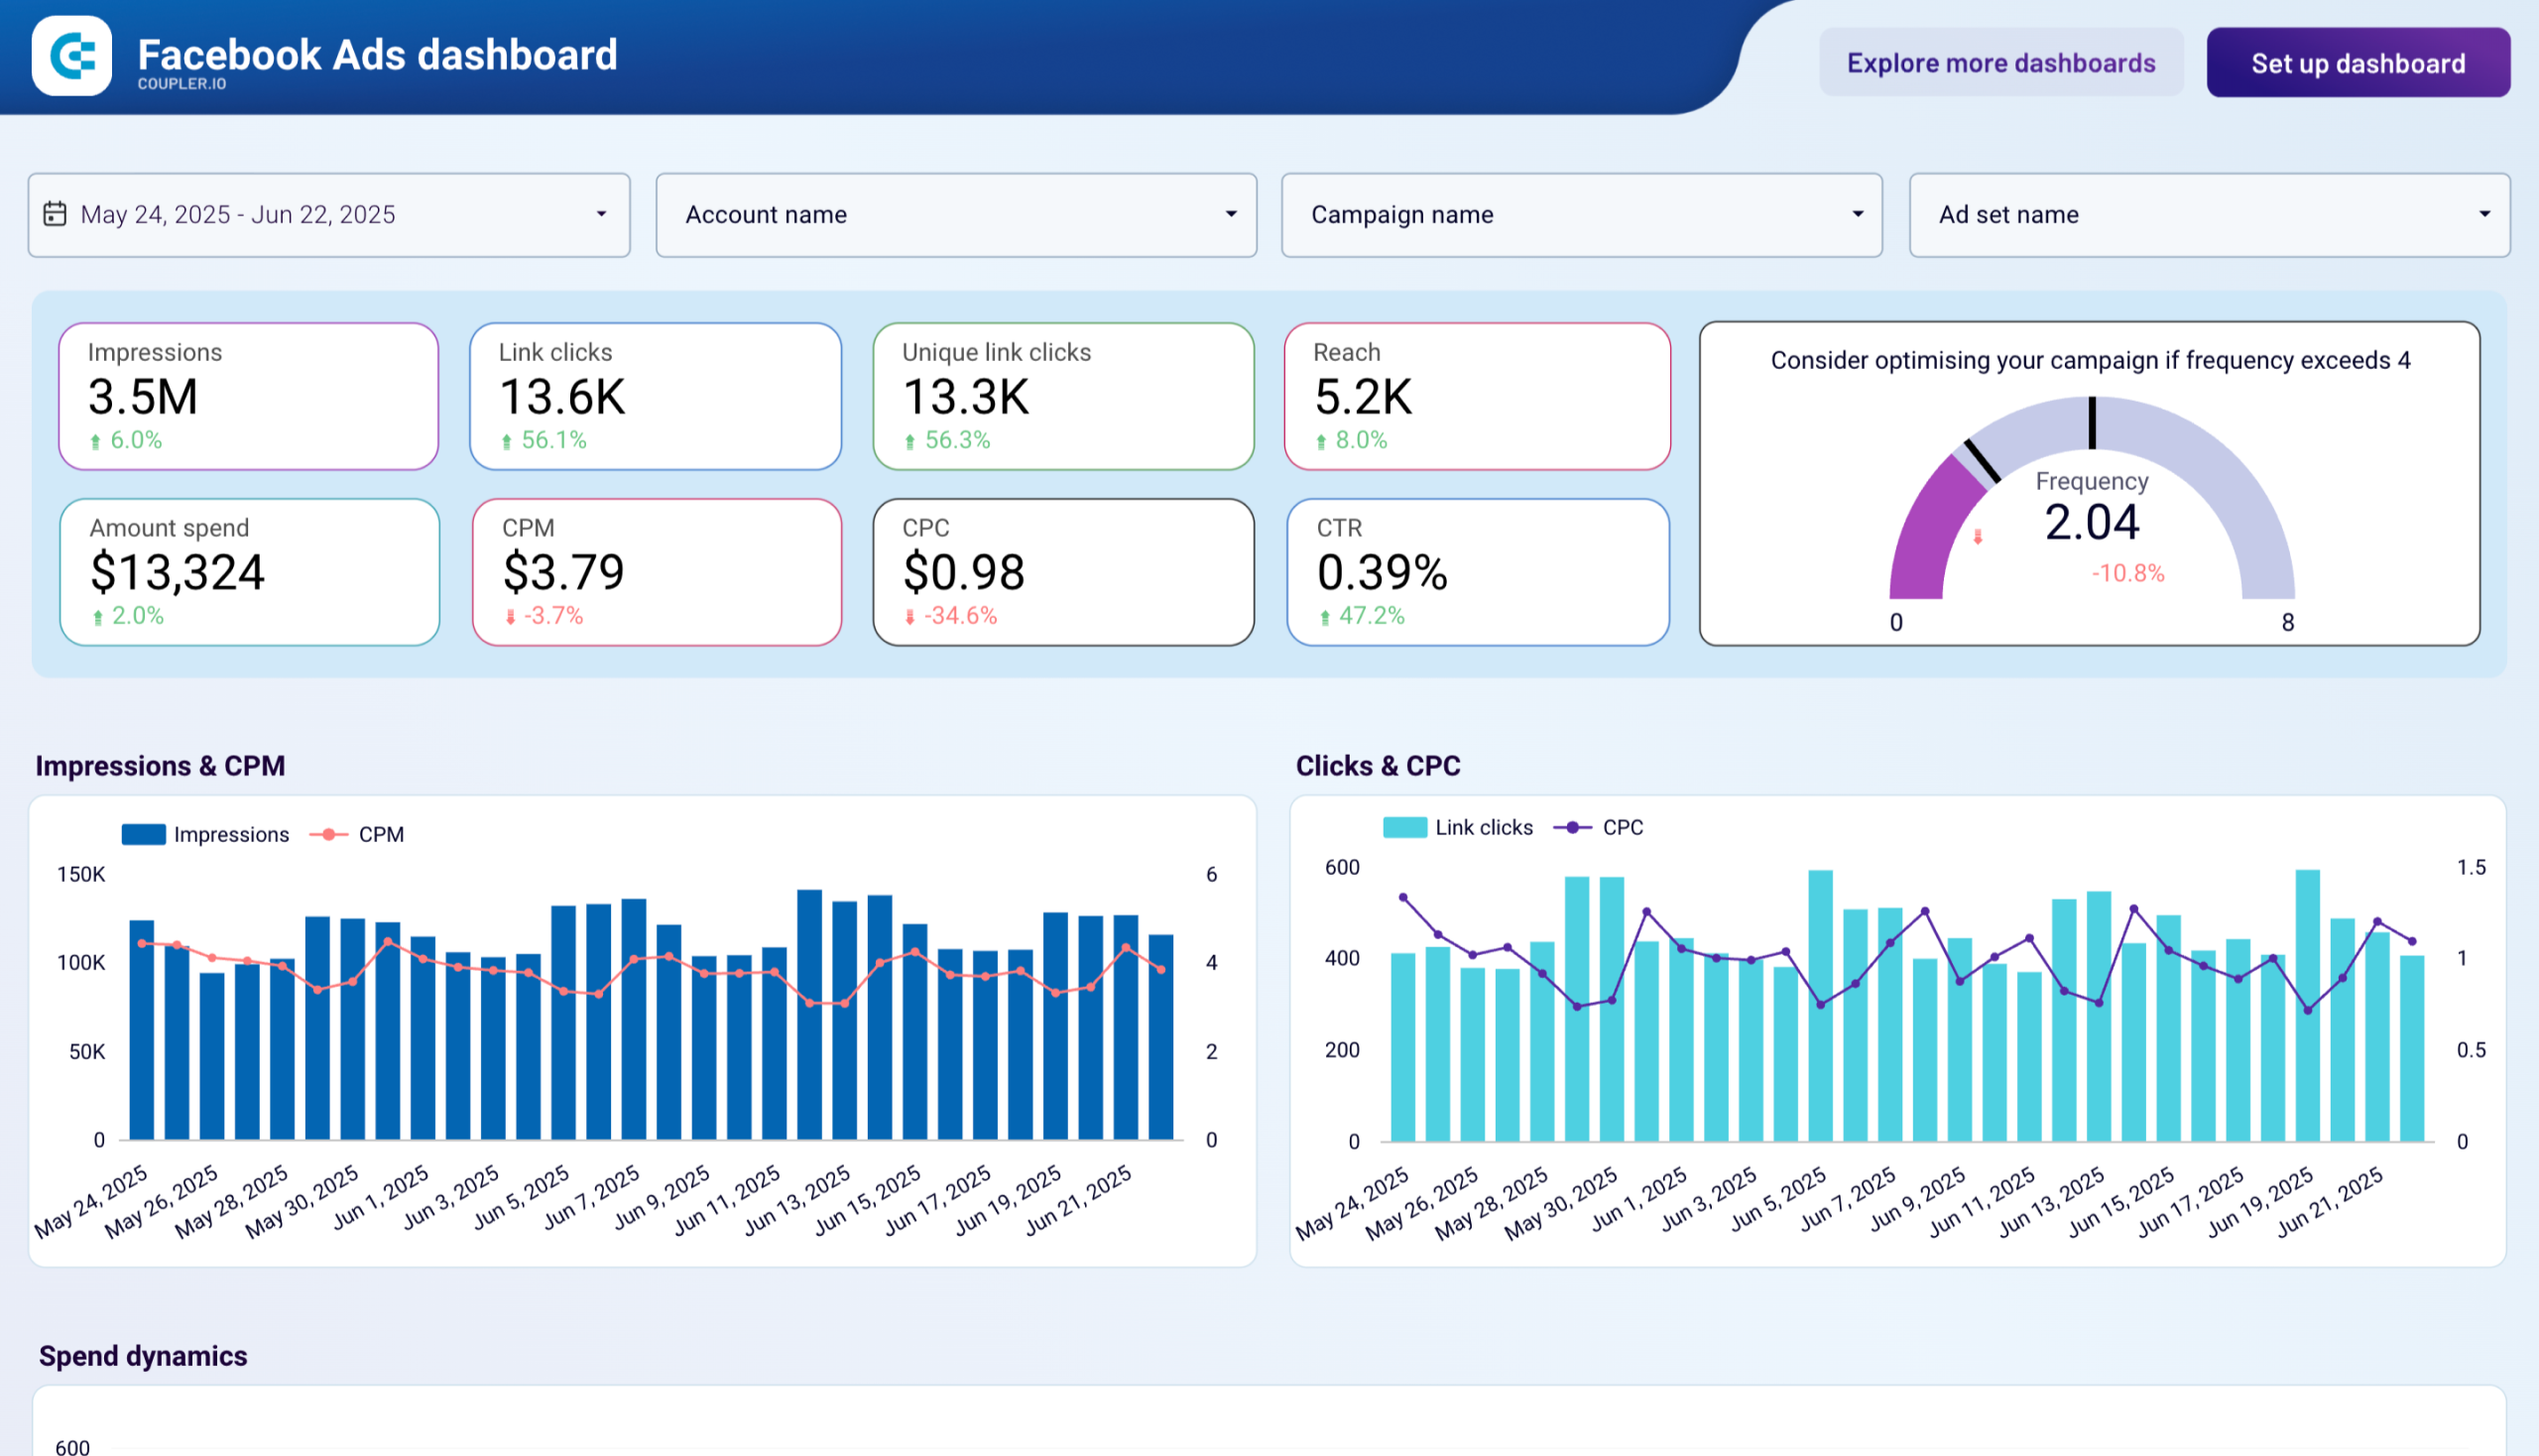


Meta Ads monthly performance dashboard
This advanced reporting template focuses on monthly performance analysis with demographic breakdowns and seasonal trend identification across Facebook and Instagram campaigns.
Meta Ads monthly performance dashboard
 Preview dashboard
Meta Ads monthly performance dashboard
Preview dashboardKey features of the dashboard template
- Monthly audience demographic engagement tracking across age groups and gender segments
- Device performance analysis optimized for mobile-first advertising strategies
- Geographic market performance with international expansion opportunity identification
- Campaign frequency management to prevent ad fatigue and optimize reach
- Seasonal trend analysis for strategic budget planning and campaign timing
The dashboard integrates with Facebook and Instagram Ads through the Coupler.io connector, automatically importing monthly performance data with demographic and geographic filters pre-configured for comprehensive audience analysis.
Meta Ads placement performance dashboard
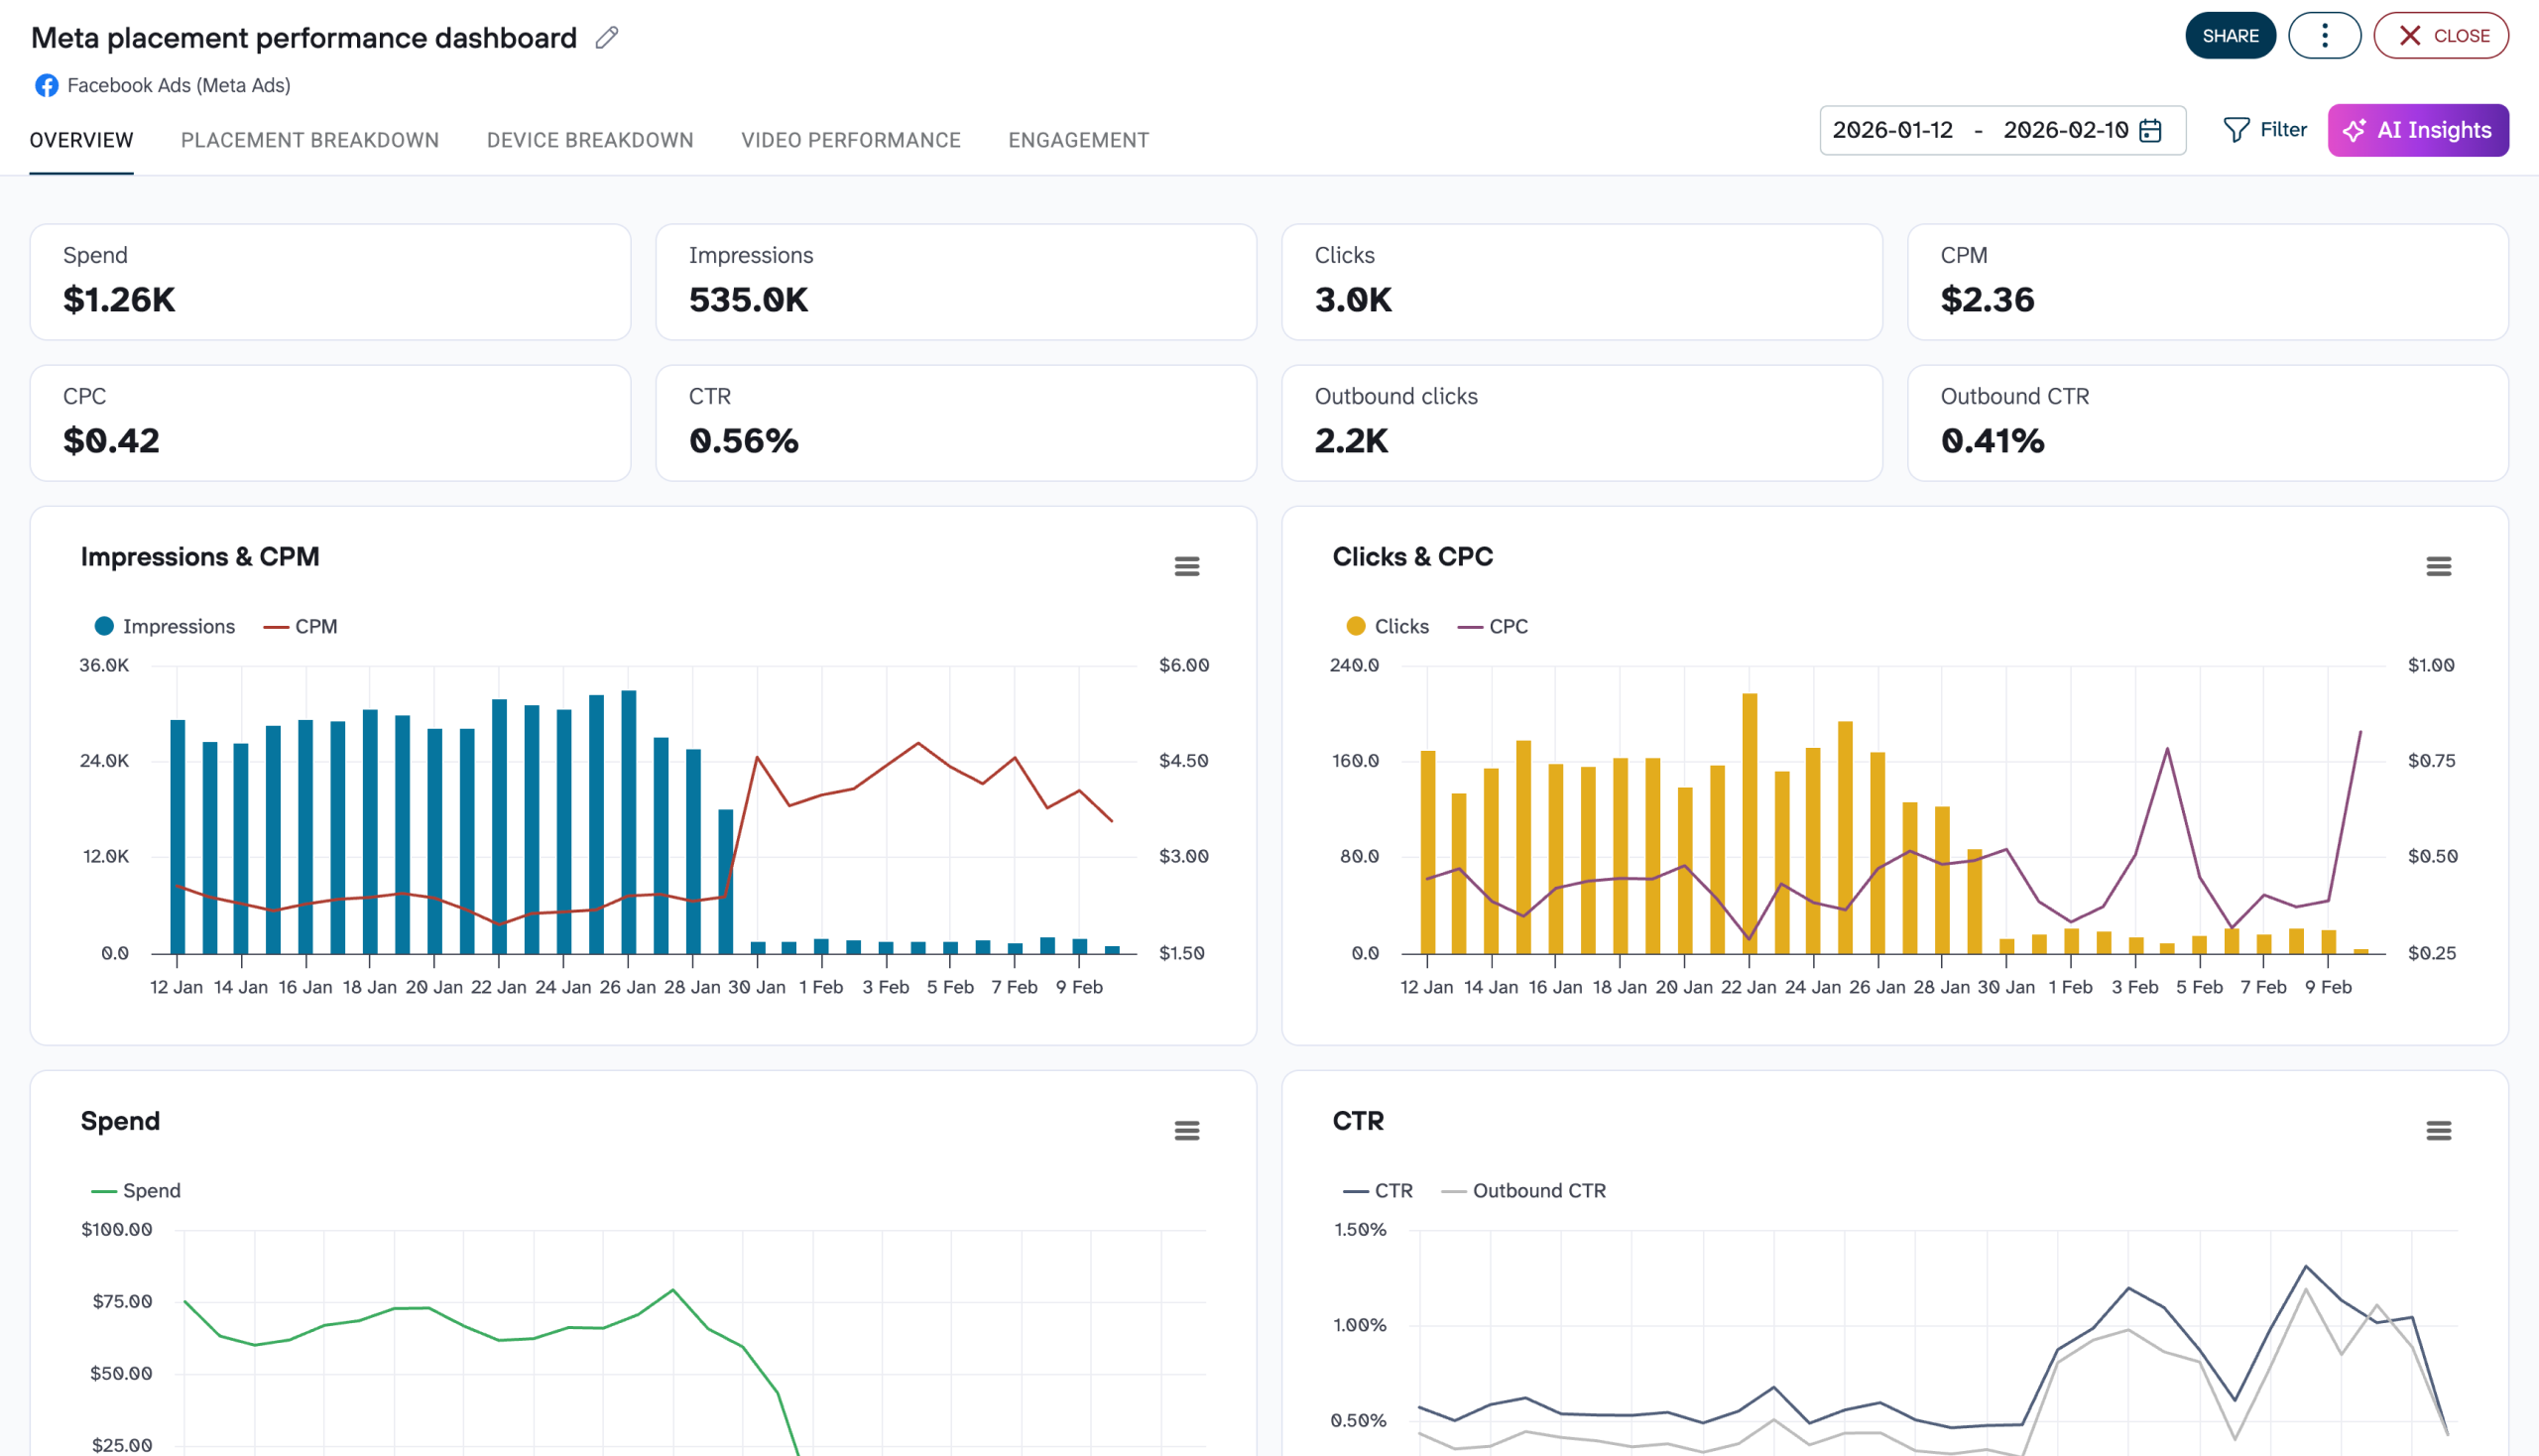
If you’re using Advantage+ placements or running ads across multiple formats, the aggregate numbers in Ads Manager won’t tell you which placements are actually earning their share of the budget. This dashboard breaks your Facebook Ads data down by placement and device so you can report on each one individually.
Meta Ads placement dashboard template
 Preview dashboard
Meta Ads placement dashboard template
Preview dashboardKey features of the dashboard template
- Placement efficiency breakdown: Compare CPM, CPC, and CTR across every Meta placement side by side.
- Video completion funnel: Track view-through rates at 25%, 50%, 75%, 95%, and 100% alongside Thruplay data to evaluate video ad retention by placement.
- Device performance analysis: See how mobile app, desktop, and mobile web users respond to your ads and whether engagement patterns differ across devices.
- Weekly trend monitoring: Spot declining placements early.
- Campaign-level cross-tables: Check whether a placement that performs well for one campaign underperforms for another.
Connect your Facebook Ads account through Coupler.io to populate the dashboard automatically. Data refreshes on a schedule, so your placement report stays up-to-date without manual exports.
Facebook Ads leads breakdown dashboard template
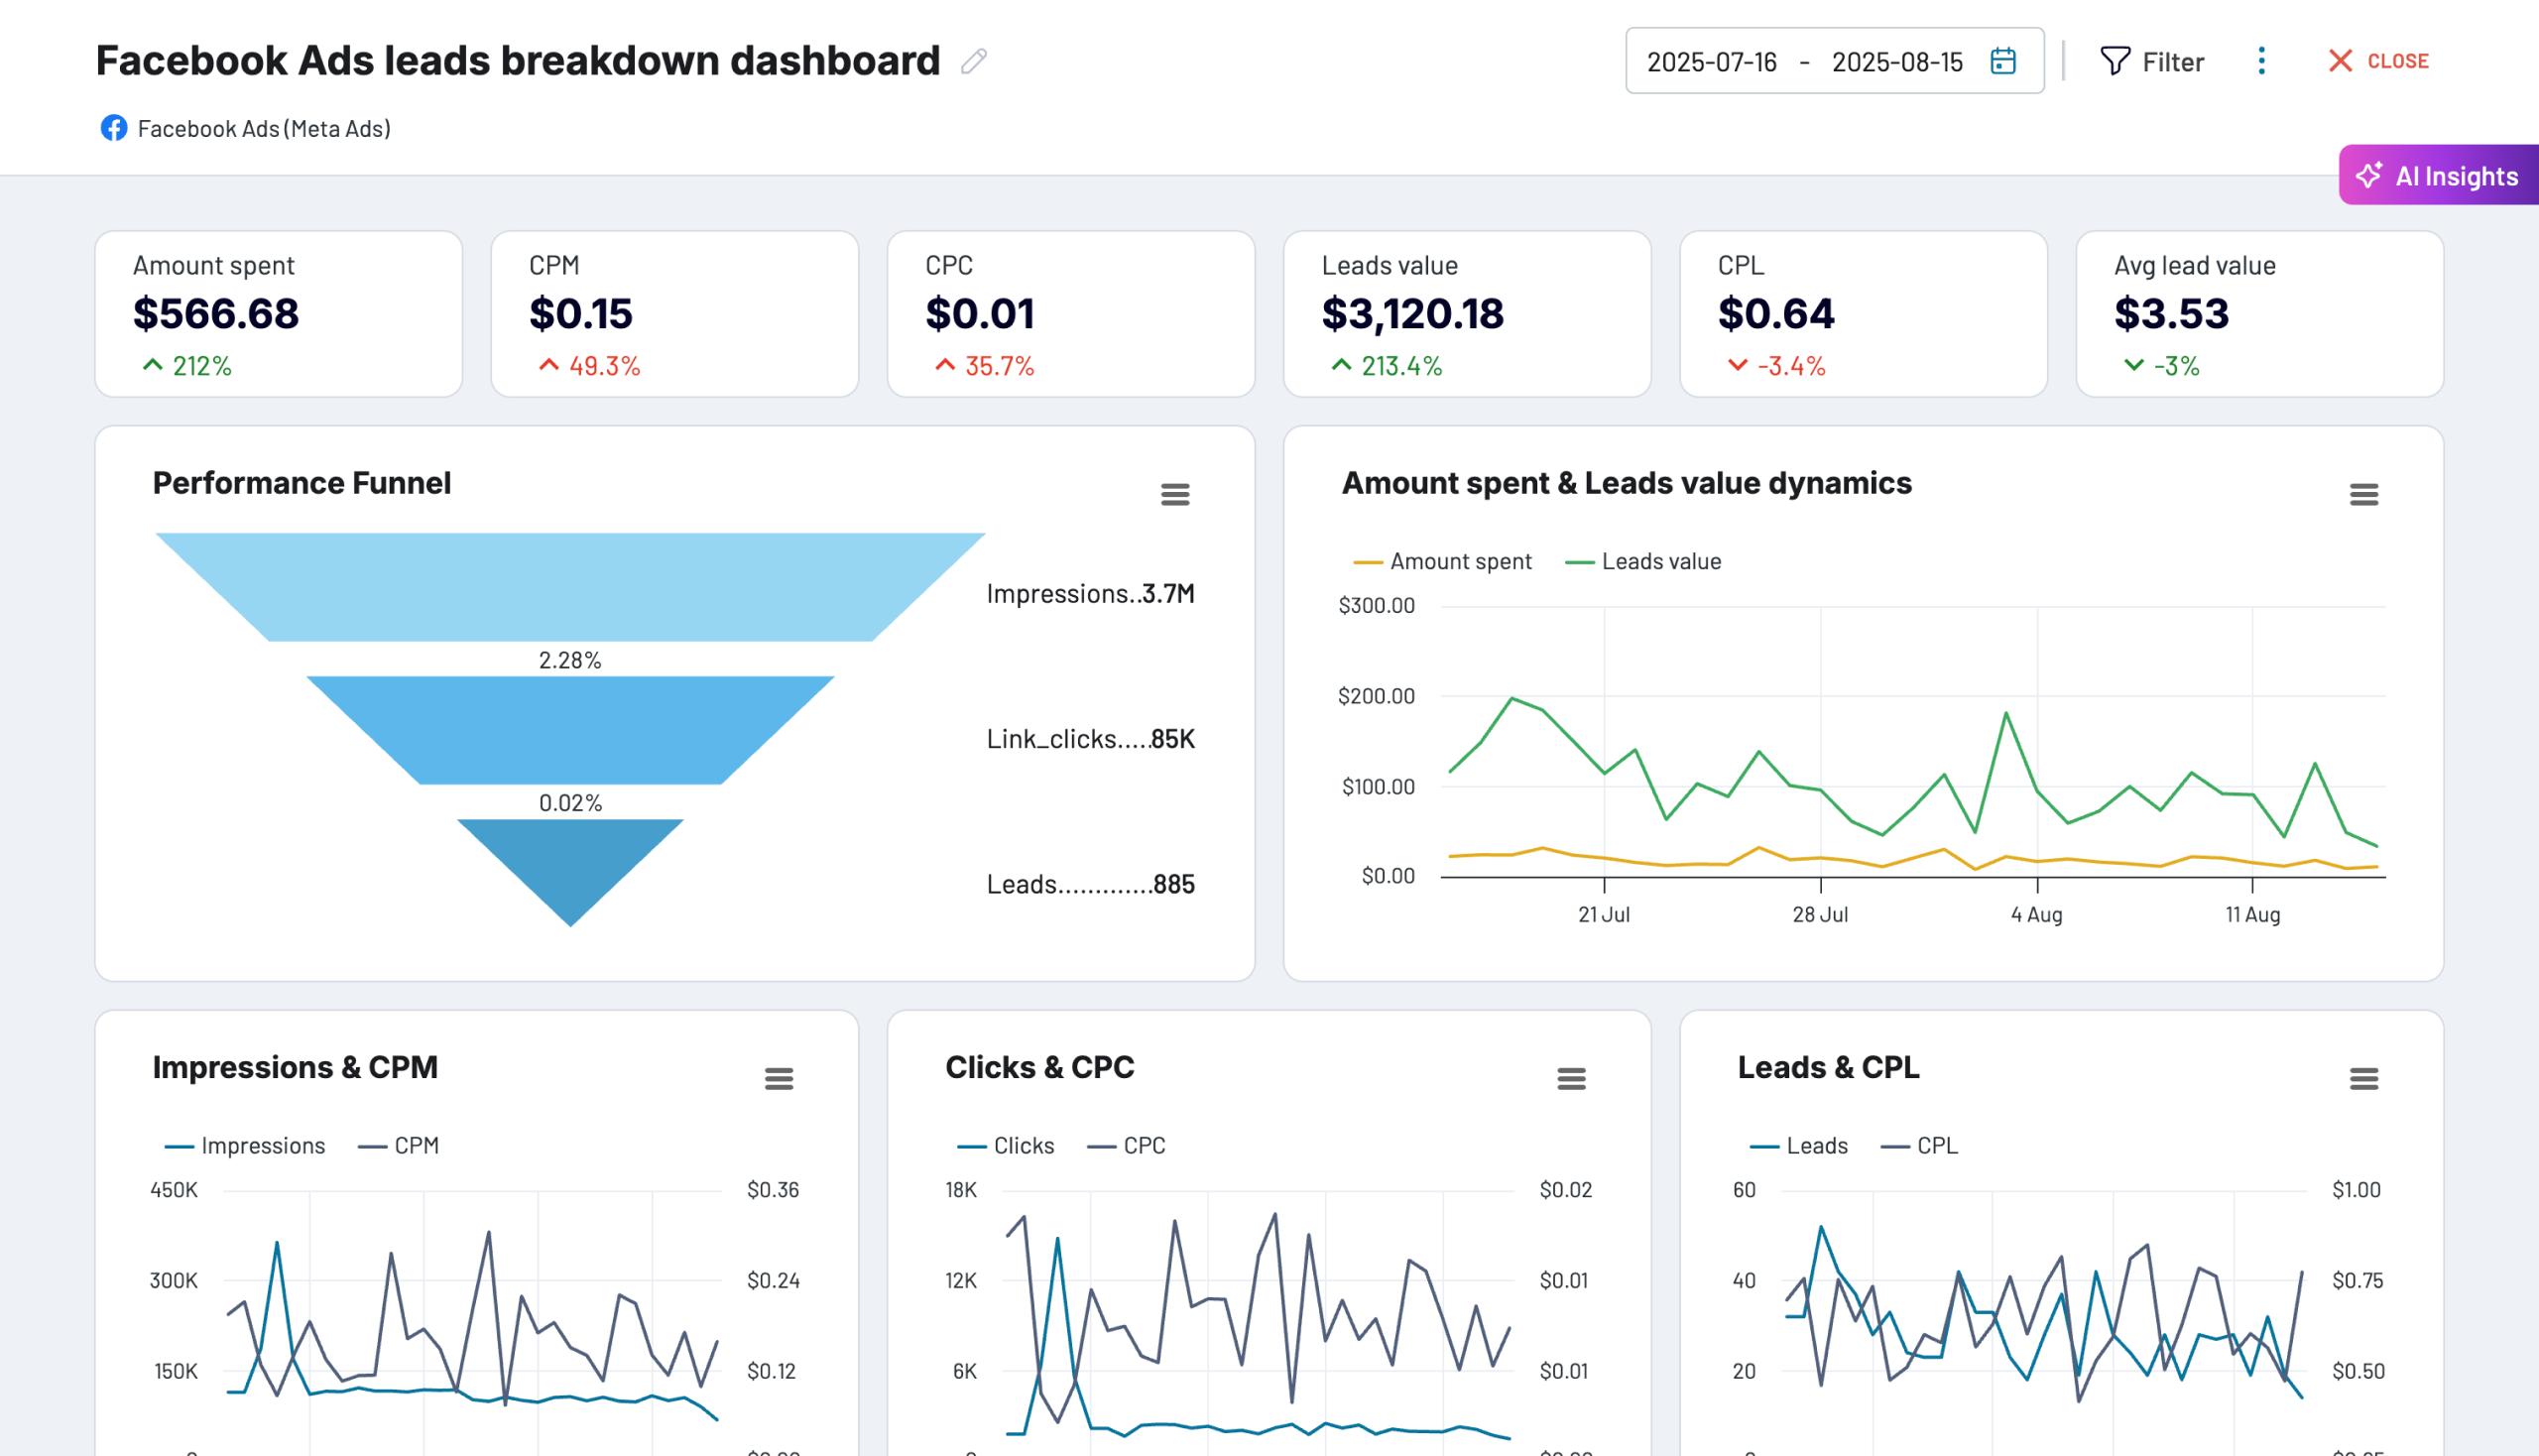
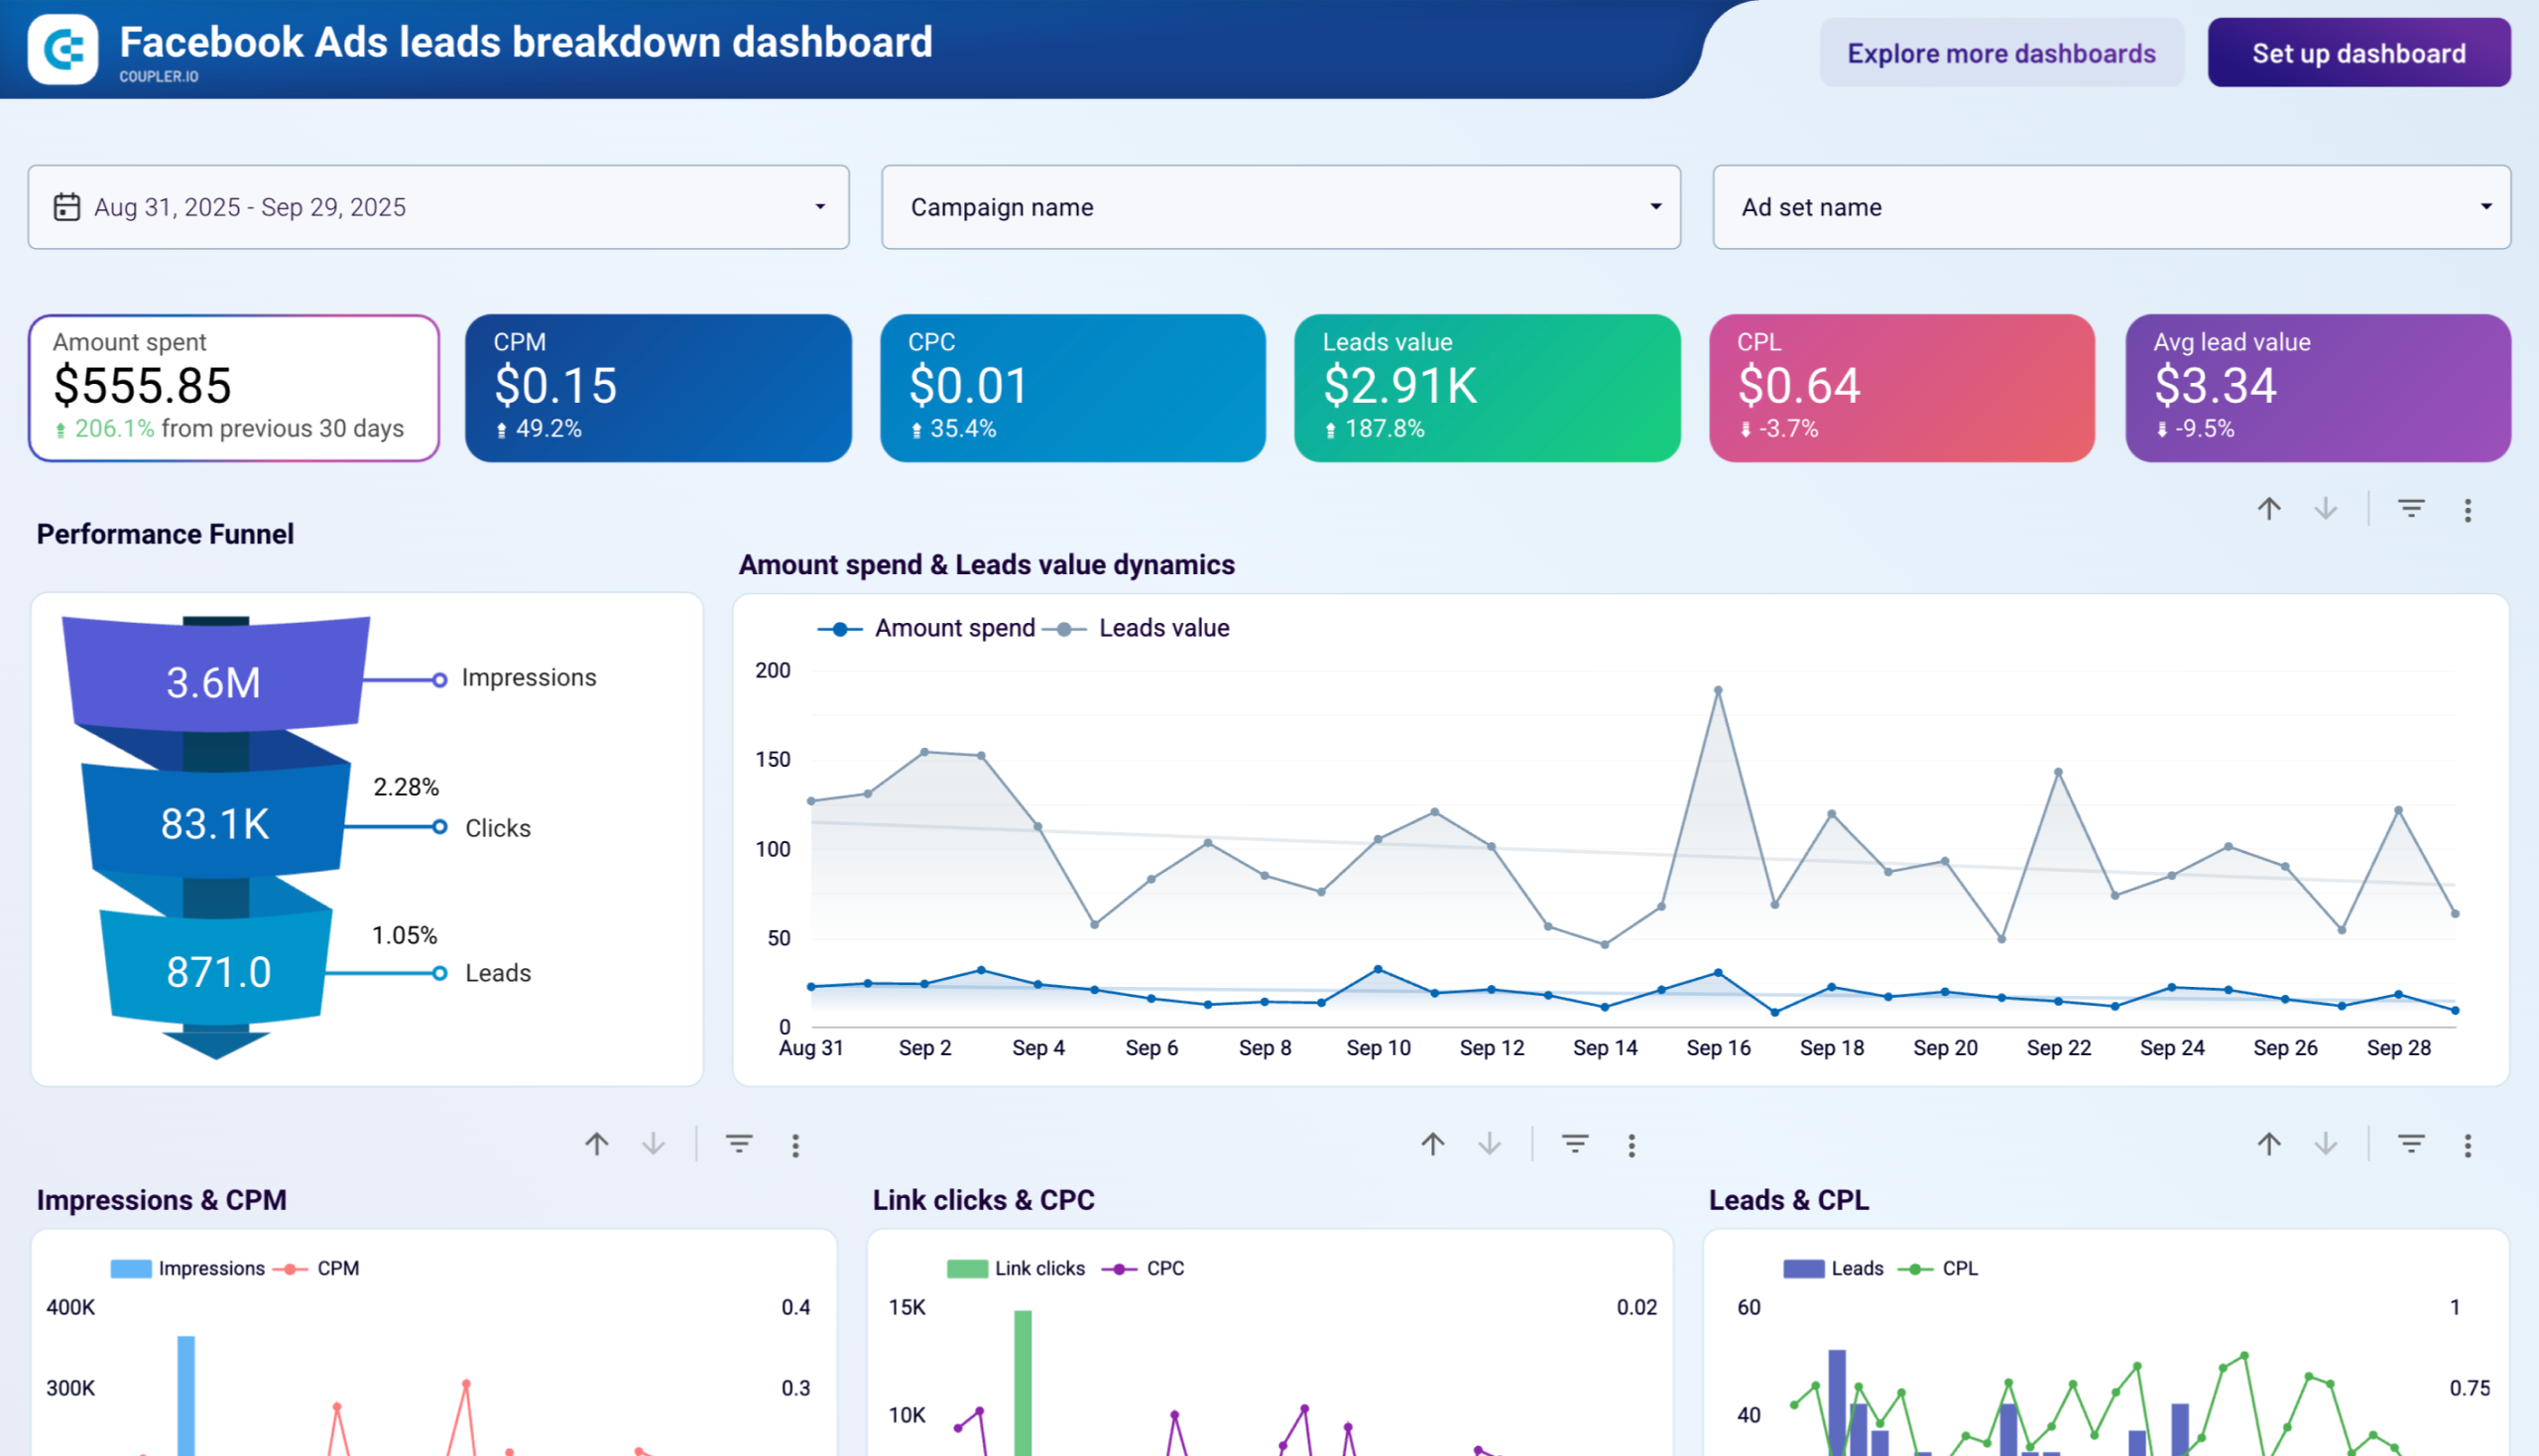
You can simply export leads from Facebook Ads manager to spreadsheets, but why, if there is a ready-to-use report to evaluate the performance of your Facebook Ads in lead generation?
Facebook Ads leads breakdown dashboard
 Preview dashboard
Facebook Ads leads breakdown dashboard
Preview dashboardKey features of the dashboard template
- Performance funnel + leads value dynamics: Visualize the funnel from clicks to leads and track the total value of leads over time.
- Campaign performance breakdown: Drill down into campaign-specific lead data to compare performance.
- Monthly dynamics: See how lead metrics change month to month.
- Leads by demographics: Analyze lead data by age, gender, and other demographics.
- Country breakdown: Spot the top countries for lead generation and adjust your targeting strategy as needed.
This dashboard is available in Coupler.io and as a template designed in Looker Studio and powered by Coupler.io. Simply connect your Facebook Ads account to load your data and start tracking your leads’ journey in minutes.

Facebook Ads purchases breakdown dashboard template
This Facebook Ads report template lets you assess your ad campaigns’ ability to generate purchases. It’s designed in Looker Studio and powered by Coupler.io to simplify connection to your ad performance data.
Key features of the dashboard template
- Purchases value dynamics: Track how purchase value fluctuates over time and compare it to ad spend for ROAS analysis.
- Performance funnel: Measure the efficiency of your campaigns as impressions turn into purchases.
- Campaign performance breakdown: Evaluate purchase count and value across campaigns.
- Monthly dynamics: Review monthly changes in key metrics such as purchases and clicks.
- Purchases by demographics: Identify which demographics contribute most to revenue generation.
- Country breakdown: Pinpoint top-performing countries for purchases and refine your strategy.
Load the data from your Easily connect your Facebook Ads account to start tracking purchase performance with this ready-to-use dashboard.
The native Facebook Ads reporting tool
Now, let’s see what are the native reporting options available in Meta Ads Manager.
You can find the Ads Reporting tool by clicking the All tools button in your Facebook Business Account.
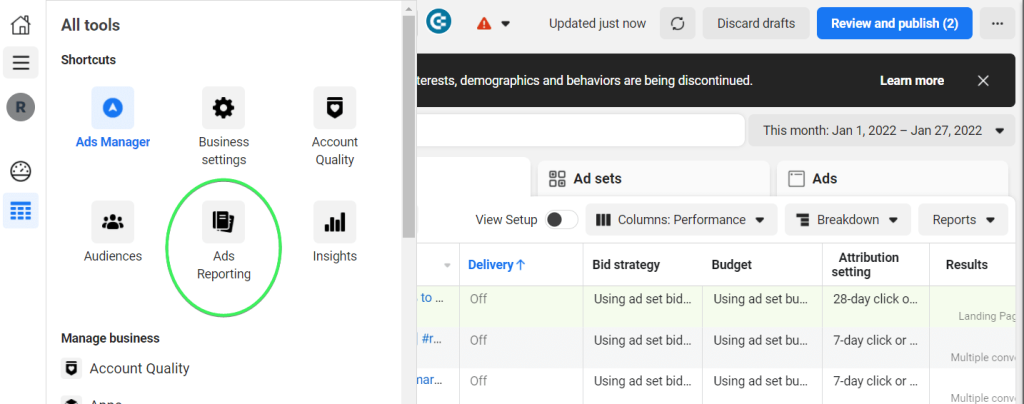
The tool is designed to create, export, share, and schedule ad performance reports. You can either build reports from scratch or use templates, such as Overall performance or Engagement reports.
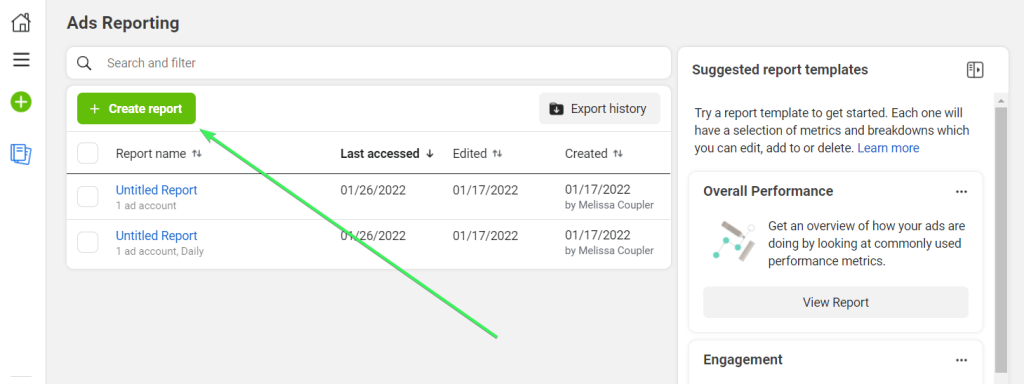
To create a report, click the +Create report button in Ads Reporting.
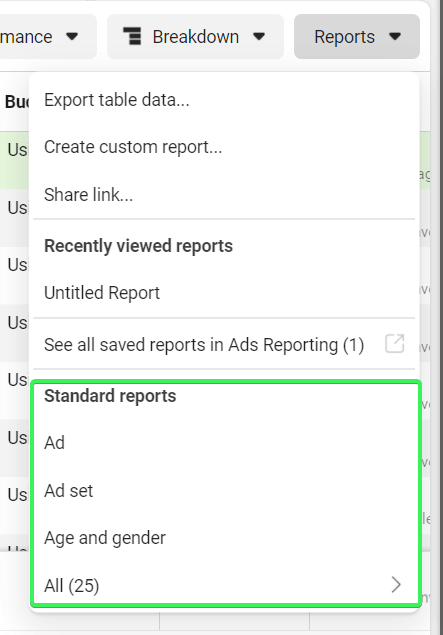
An alternative path to reporting Facebook ads is right from Ads Manager. You need to select the data you want to include in your report, for example, a campaign, and click the Reports menu.
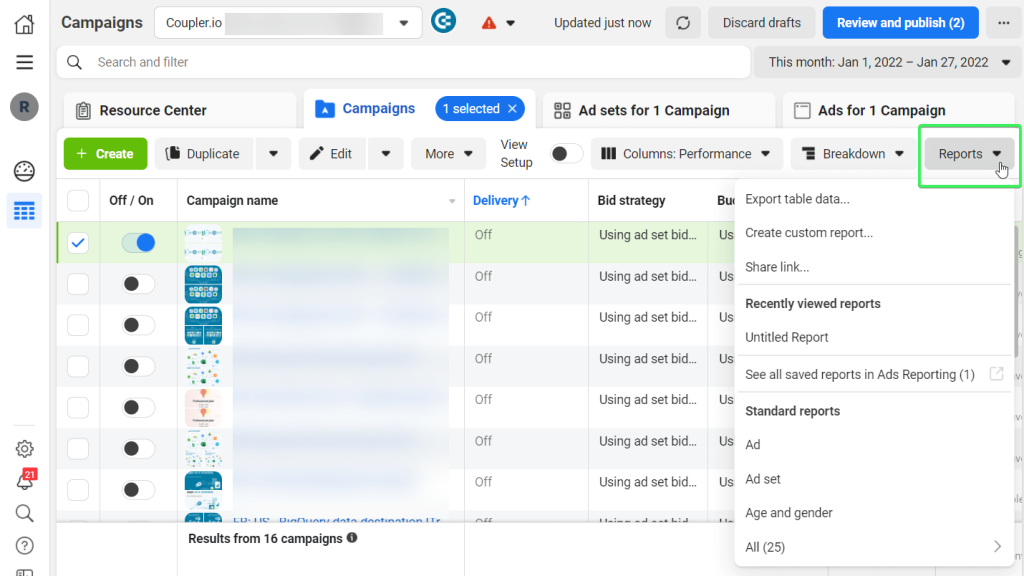
In the dropdown menu, you can select any of the following options:
- Export table data… – this will let you export data from Facebook Ads to Excel, CSV, or Ads Reporting tool.
- Create custom report… – this will redirect you to the Ads Reporting dashboard right away.
- Choose any of the suggested Standard reports, such as Ad set, Region, Platform, etc.
Whichever option you choose, you’ll find yourself on the dashboard with different parameters.
What does the native Facebook Ads reporting dashboard look like?
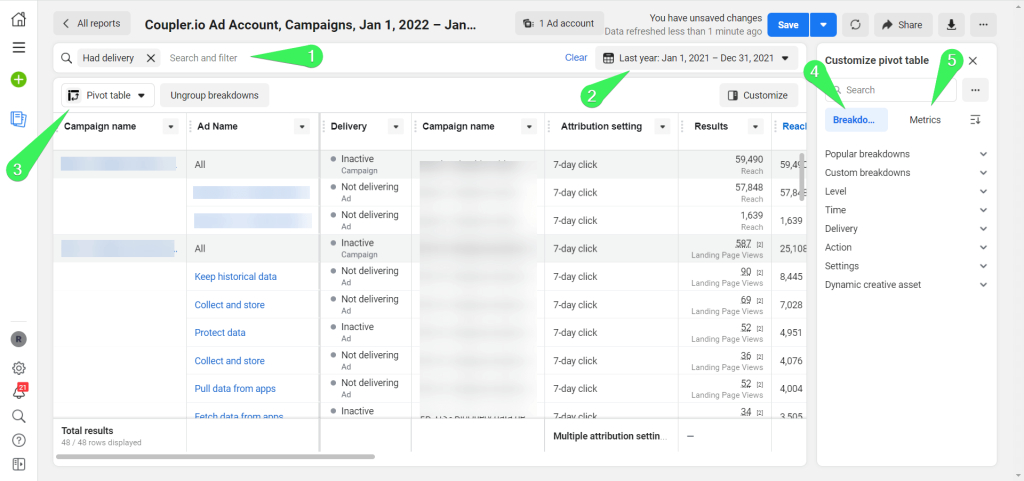
- Filters for the report
- Date range for the report
- Report layout: pivot table, trend or bar
- Breakdowns for the report
- Metrics for the report
These elements of the Facebook Ads Reporting dashboard enable you to customize your reports. So, you will be able to gain more details on the effectiveness of your ads so that you can make informed decisions. Below are some of the parameters you can use to customize and assess the performance of your Facebook ads.
Facebook Ads report layout
There are three design layout options for your Facebook Ads reports:
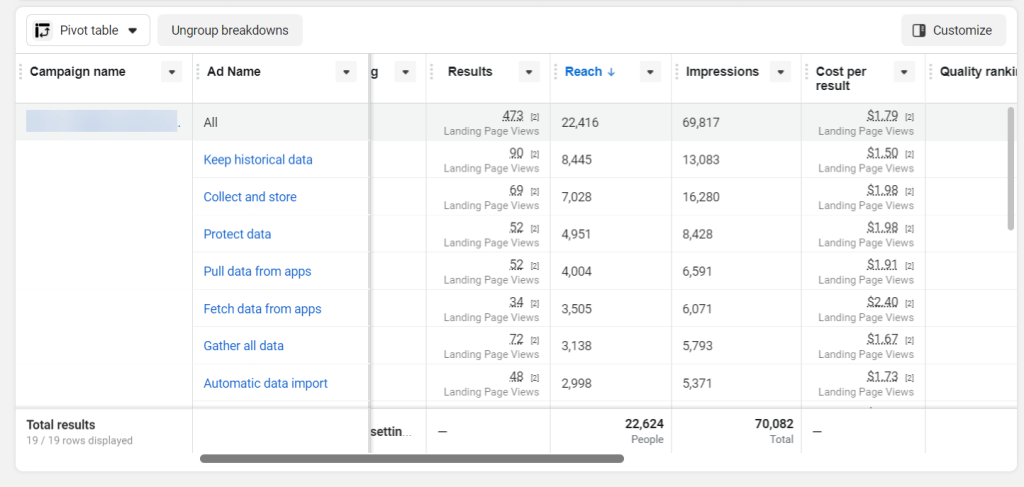
- Pivot table – use this if you want to see more details and granularity in your ads report
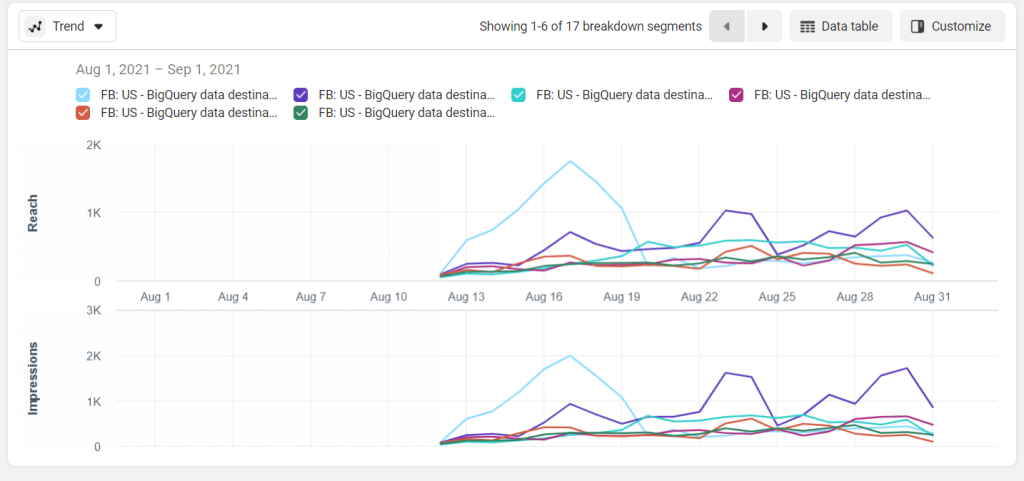
- Trend – use this if you want to understand trends by comparing metrics.
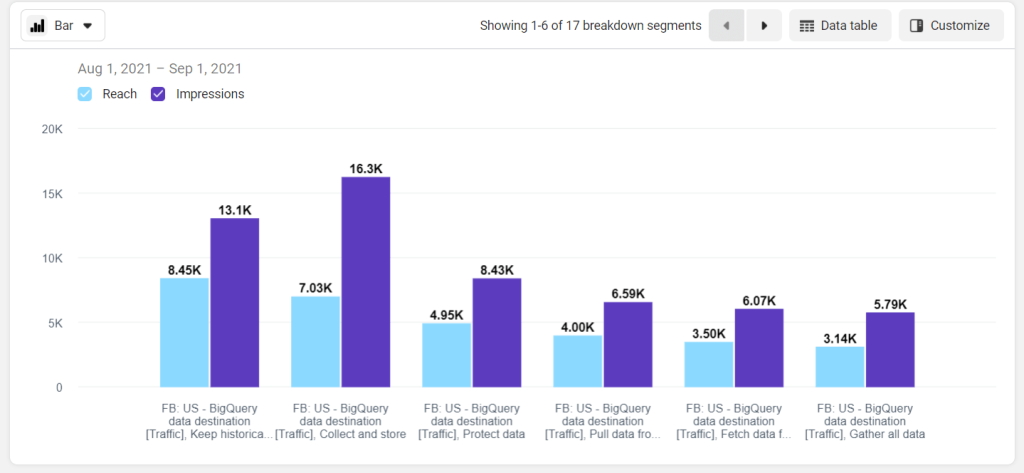
- Bar – use this if you want to compare metric values across different sets of your data.
Here is a short summary of the Facebook Ads reporting layouts:
| Layout | Formatting options |
|---|---|
| Pivot table | Rows represent breakdowns. Columns represent metrics. |
| Trend chart | Breakdowns are lines. Each line represents a different breakdown segment. X-Axis represents the time interval. Y-Axis represents metrics. You can select up to two metrics which will be graphed on different charts. Choose the metric or breakdown to sort your lines in ascending or descending order. You can include up to 10 lines that will represent breakdown values in your chart. |
| Bar chart | Breakdowns are bar groups. Each bar group represents a different breakdown segment. Bars represent metrics. You can select up to three metrics per chart. Choose the metric or breakdown to sort your bars in ascending or descending order. You can include up to 10 bar groups that will represent breakdown values in your chart. |
Breakdowns for Facebook ads reports
Select breakdowns to customize the way your data appears in reports. The available breakdown options differ based on the report layout you choose. The biggest number of breakdowns are available for the pivot table and include:
Level
- Campaign name
- Ad Set name
- Ad name
- Page name
- Campaign ID
- Ad Set ID
- Ad ID
- Page ID
- Ad creative
Time
- Day
- Week
- Two weeks
- Month
These time frames provide the volatility costs of your ads. For longer-running campaigns, it’s best to use long time frames from weekly to monthly to get a better picture of your campaign progress. For example, if you see the weekly costs start to rise, it can be a signal for you to take appropriate action.
Delivery
Breakdown by Age, Gender, Region, Media type, and so on. This category allows you to see more information about the audience of your ads. Here are some of the options available:
- Age: the results of the ad costs are divided by age group. This way, you can see which age group is wasting your money and help to refine the parameters of your ad for more effective results.
- Country: this option enables you to see the costs of the ads for specific countries. With this information, you can allocate your resources accordingly for better results.
- Business locations: this option is available when using dynamic page location targeting in which Facebook places your ads to the target audience closest to your business location.
- Region: state or province.
- Impression device: it provides information on the type of device that viewed your ad, for example, Android smartphones, iPhone, desktops, iPad.
- Platform: this shows the platform in which your ads were viewed e.g. Facebook or Instagram.
- Product ID: it is available if you have a product catalog. There are more options in which you can further refine your results from Product ID.
Action
- Conversion Device
- Post reaction type
- Destination
- Video view type
- Video sound
- Carousel card
- Instant experience component
- Category
- Brand
This category allows you to see more information on the actions taken as a result of your ad. Here are some of the options available:
- Conversion device: it shows the volume of devices that have viewed the ad.
- Post reaction type: it lists the types of reactions and the number of times each reaction was used.
- Video view type: it separates videos that were viewed on autoplay and those that were clicked to play.
- Video sound: this option separates videos that were played with sound and those played without it.
- Carousel card: it allows you to view clicks of carousel cards and know which one generated maximum engagement.
Settings
Breakdown by custom settings you apply for your ads.
Dynamic creative asset
- Call to action
- Description
- Headline
- Image
- Text
- Video
- Website URL
Each option allows you to separate the variations generated for each dynamic creative type. However, this option is not available when viewing from the campaign level.
Metrics for Facebook Ads reports
Here are the groups of metrics available for building Facebook ads reports:
- Performance metrics – monitor the performance of your ads with the help of such metrics as Reach, Impressions, Clicks, etc.
- Engagement – learn how engaging your ads are, using such metrics as Page likes, Post comments, Link clicks, etc.
- Conversions – investigate the financial part of running Facebook ads with the help of conversion metrics including Adds to cart, Cost per add to wishlist, Credit spends, etc.
- Custom Events and Custom Conversions – custom events and conversions that you can apply, for example, Scroll 50% or Scroll 50% Conversion Value.
- Settings – set metrics based on Buying type, Campaign name, Call to action, and many more.
With the breakdowns and groups of Facebook metrics specified, you can set up filters for your reports.
Meta Ads monthly performance dashboard
This advanced reporting template focuses on monthly performance analysis with demographic breakdowns and seasonal trend identification across Facebook and Instagram campaigns.
Key reporting features:
- Monthly audience demographic engagement tracking across age groups and gender segments
- Device performance analysis optimized for mobile-first advertising strategies
- Geographic market performance with international expansion opportunity identification
- Campaign frequency management to prevent ad fatigue and optimize reach
- Seasonal trend analysis for strategic budget planning and campaign timing
The dashboard integrates with Facebook and Instagram Ads through the Coupler.io connector, automatically importing monthly performance data with demographic and geographic filters pre-configured for comprehensive audience analysis.
For more on this topic, check our article about Facebook Ads metrics.
Filters in ads reporting
You can filter your report in the same way you filter your ads on Ads Manager. The default filter way you see is Had Delivery, which shows items that had delivery and at least one impression. Other filtering options include Metrics, Buying type, Objective, and so on.
In the top right corner of Facebook Ads reporting, you have two buttons: Share and Export.
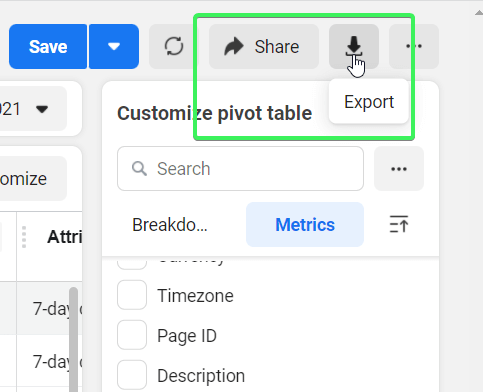
- Share – allows you to share links to your reports with users both inside and outside Facebook Ads.
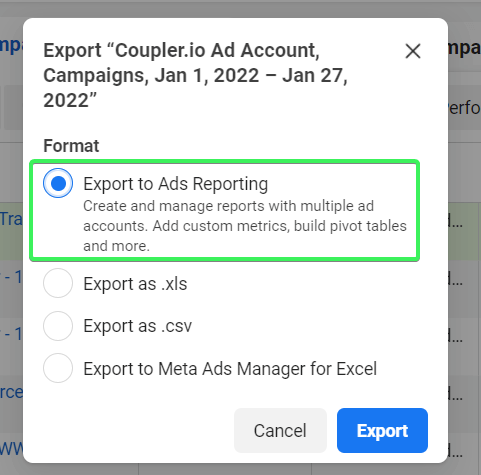
- Export – allows you to export reports as:
- Formatted data table in Excel
- Raw data table in Excel
- CSV
- Image
Exporting options are quite in demand among users who need to customize their reporting in spreadsheets or data visualization tools. Facebook Ads reporting works well for tracking daily stats, but it’s a pain when you want to build a report based on weekly, monthly, and larger historical data. Here are some other cons you may encounter dealing with the Facebook Ads native reporting tool.
Drawbacks of Facebook Ads manager reporting
- The more ads you add to your report, the longer it takes for Facebook Ads reporting to update the data.
- Filtering options are quite limited
- Grouping is not available
- Sorting is available at a primitive level – only A to Z or vice versa
- The Facebook Ads reporting dashboard only shows a few columns – you’ll have to scroll right to see other valuable metrics
- Visualization options are limited to bar and trend charts
- You can’t compare groups of campaigns
- Custom metrics are not available
- You can’t see reports for different accounts at a time
Considering the above, exporting Facebook Ads to Google Sheets seems to be a perfect solution to customize this social media reporting. However, the native option does not let you automate this. So, for example, for daily reports, you’ll have to export data manually every day. Fortunately, there is a method to automate this flow with just a few clicks.
But you may be interested in designing a custom integration using Google Apps Script, Python, or any other programming tool. To do this, you’ll need the Facebook Ads API.
Facebook Ads API reporting
Facebook Ads reporting API is called Facebook Insights API. Basically, this is just an endpoint within the Marketing API. With it, you can export stats about Facebook marketing campaigns. Here is the Insights API cURL syntax:
https://graph.facebook.com/{api_version}/{ads_object}/insights
The Insights API is available as on the following {ads_object}:
/act_{ad-account-id}/insights/{ad-id}/insights/{ad-campaign-id}/insights/{ad-set-id}/insights
Actually, this topic requires particular attention. We have a blog post dedicated to the Facebook Ads API where you can learn more about its authentication, examples, and other things.
How to create a custom Facebook Ads report using Coupler.io
To create custom reporting solutions using the Facebook Ads API, you require a technical background and expertise. However, Coupler.io lets you turn data from Facebook Ads into meaningful reports without coding. You can load your reports to a spreadsheet app (Google Sheets or Excel) or a BI tool (Looker Studio, Tableau, Power BI).
In addition to the standard destinations, Coupler.io enables you to integrate your data with AI using the Facebook Ads MCP. As a result, you can have conversations with AI about your performance and ask for improvement recommendations and insights.
Select the desired destination app in the form below and click Proceed. You’ll be offered to create a Coupler.io account for free. After that, complete a few simple steps.
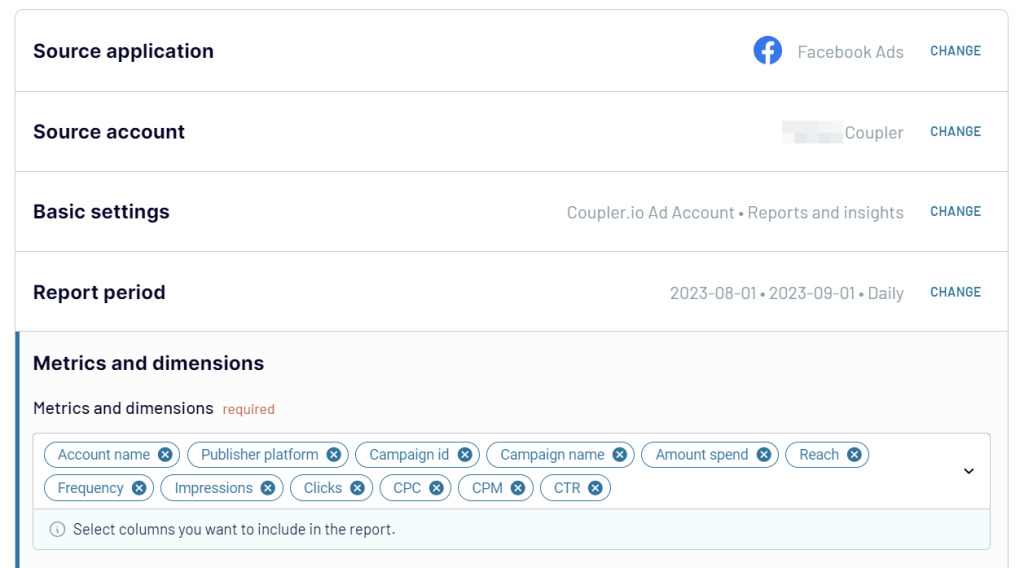
1. Collect data from Facebook Ads
Connect your Facebook Ads account and select the type of report to export. You can get a list of ads, ad sets, and campaigns, as well as the Reports and Insights data entity. The latter allows you to load information about the performance of your campaigns. When you choose it, you can specify the reporting period and metrics+dimensions such as conversions, CPC, and others to include in the report.
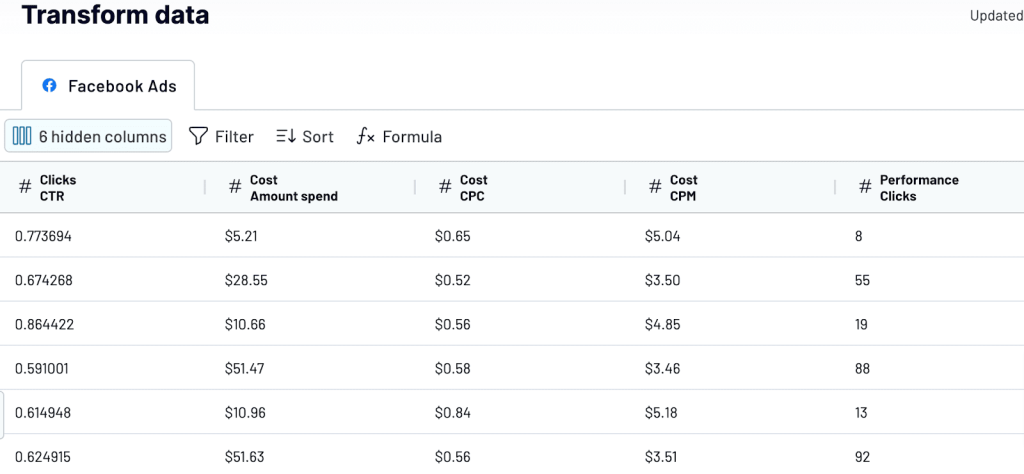
Step 2. Organize data
Coupler.io will load up to 500 rows from Facebook Ads for preview. At this step, you can also prepare your report using some transformation options:
- Hide/unhide columns
- Sort and filter data
- Add new columns using the supported formulas
- Blend data from multiple sources
By doing so, you ensure the report will be ready for analysis without any further edits to your data.
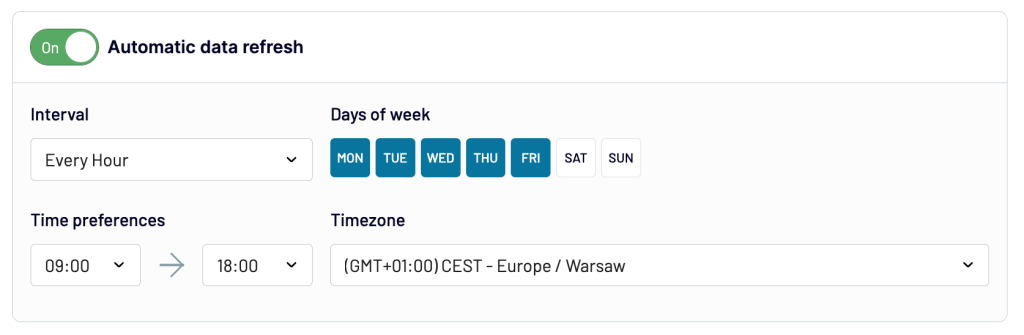
Step 3. Load data and schedule refresh
Now, follow the in-app instructions to load the data to the chosen destination. To automate data refresh, enable the respective feature and configure the schedule.
What’s next?
You can build pivot tables with just a few clicks. Or you can insert charts, scorecards, and other visuals.
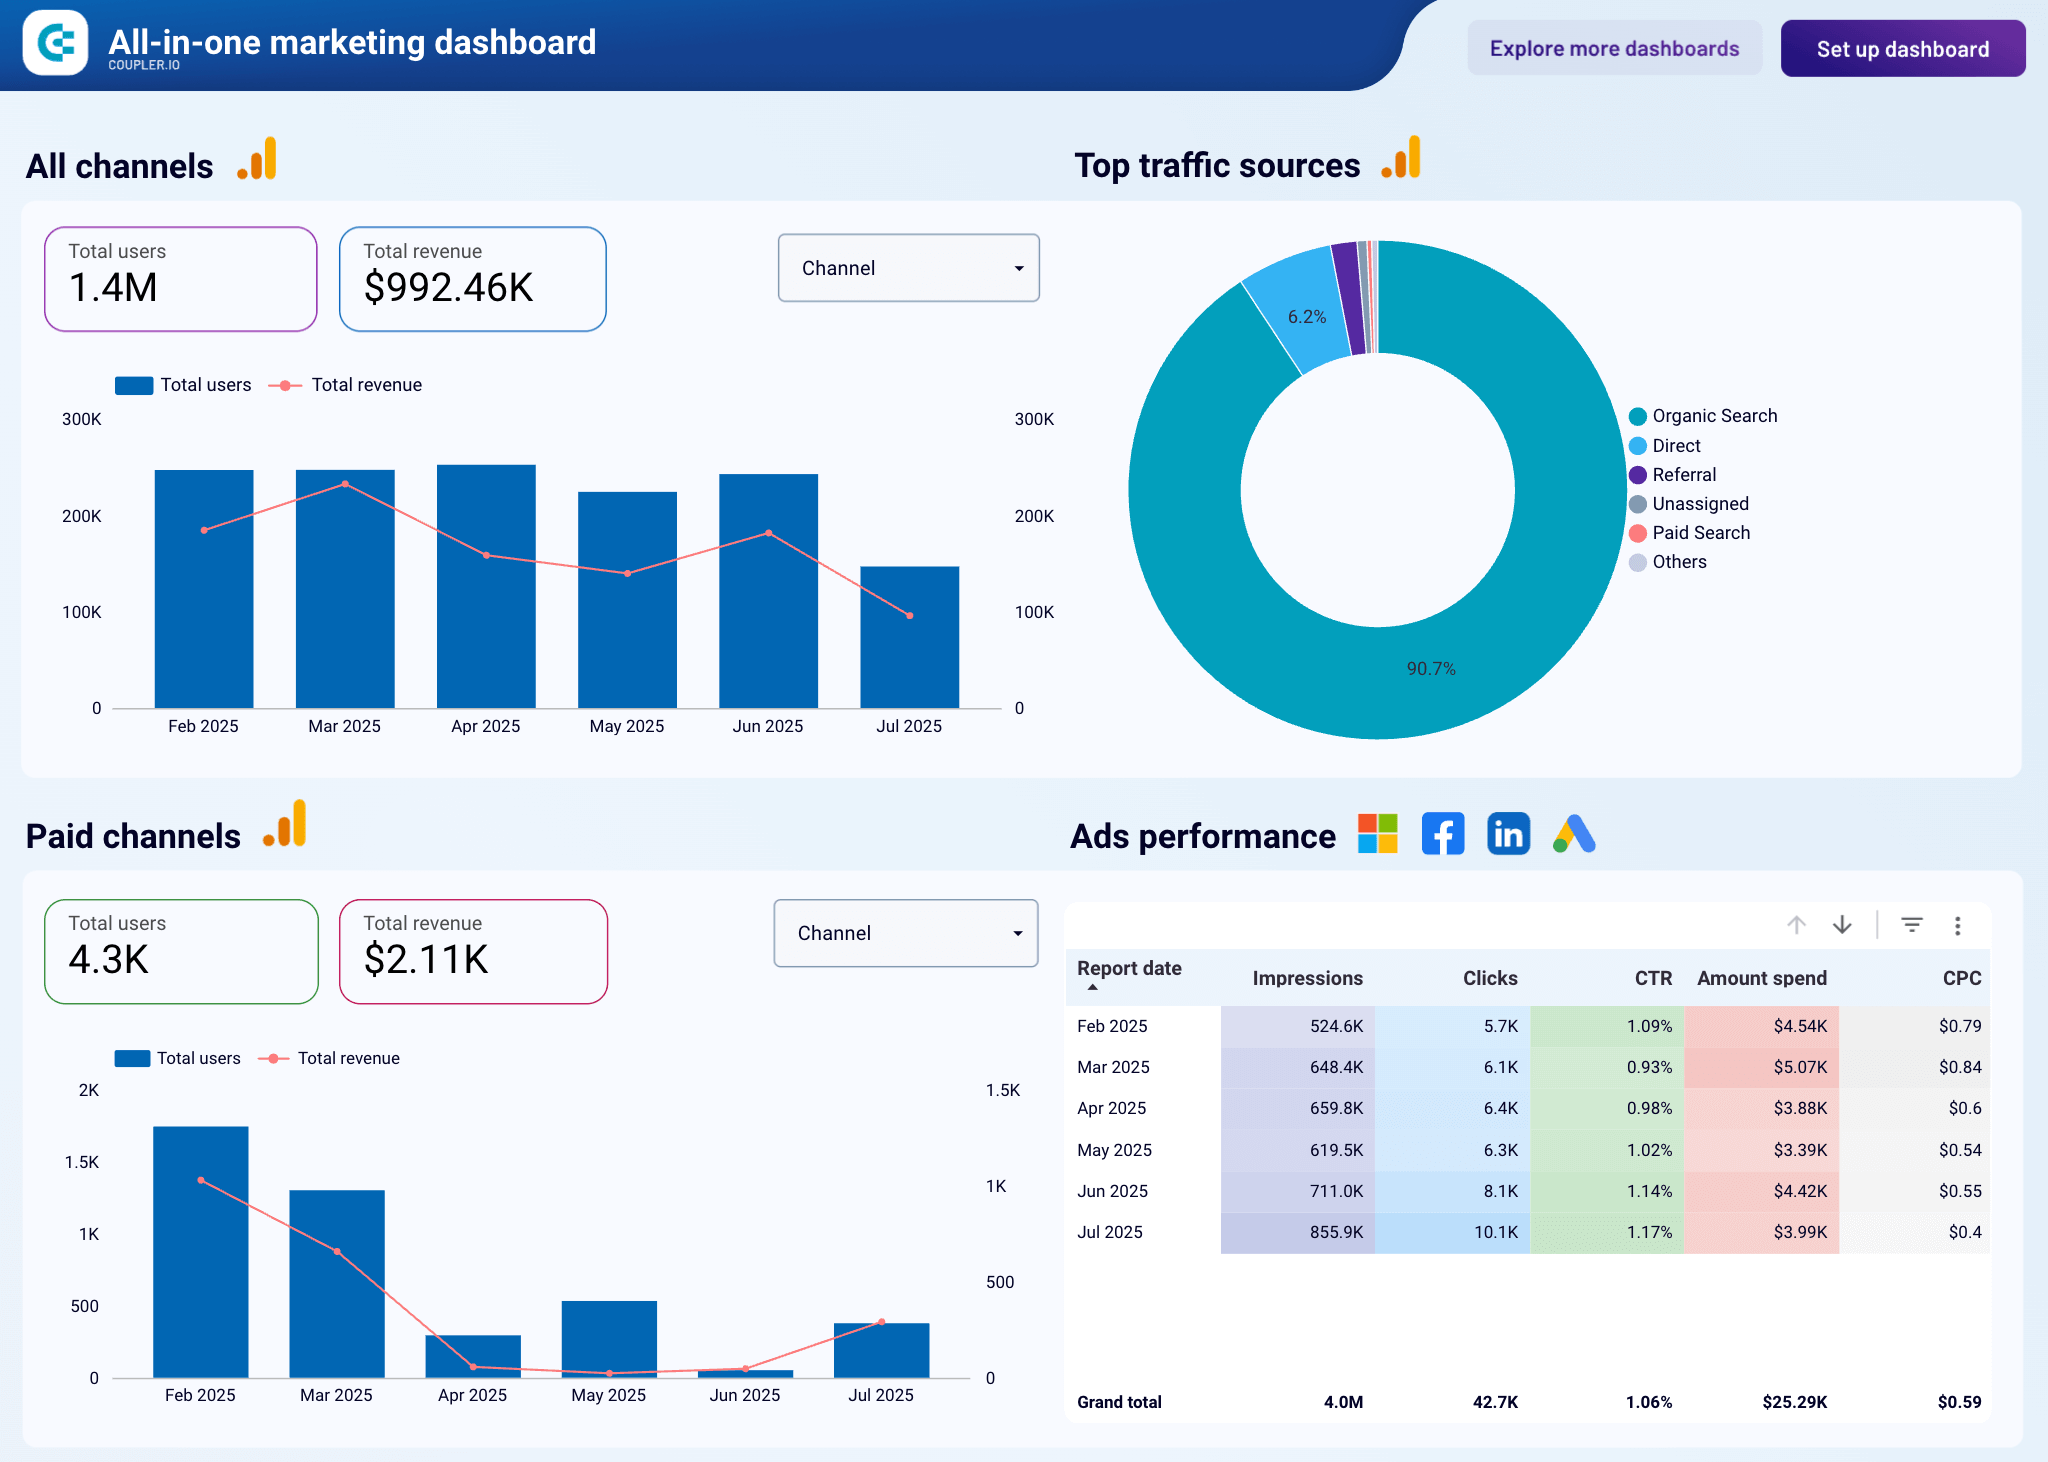
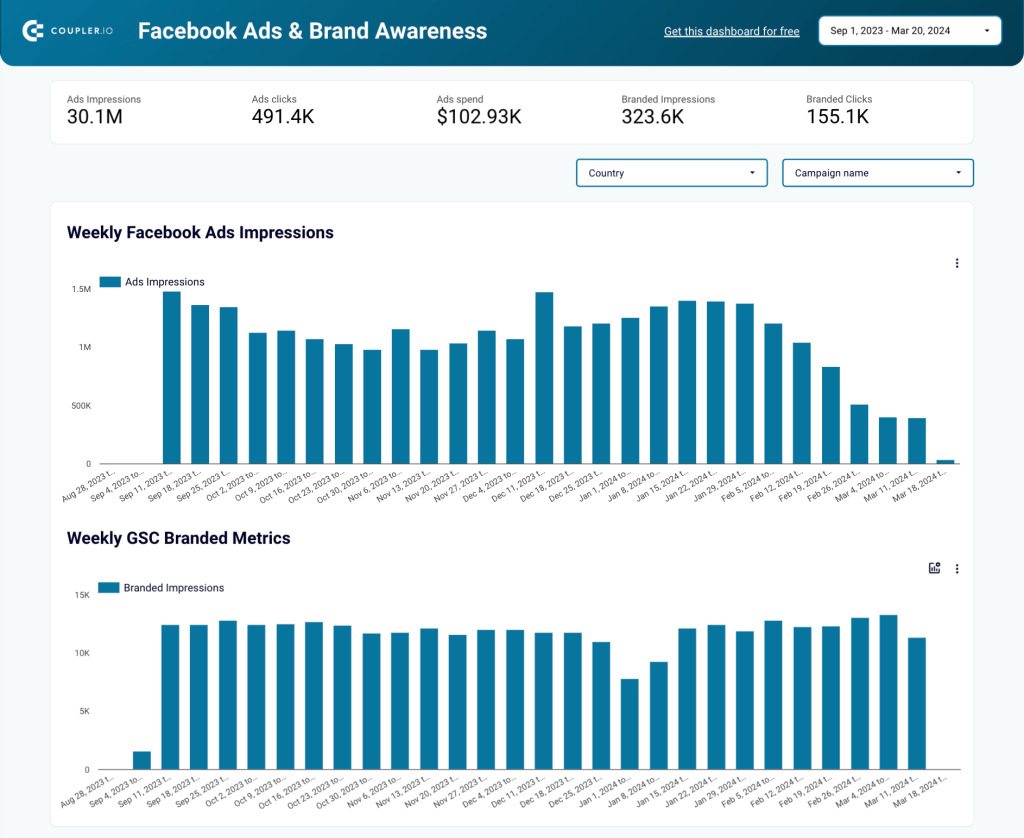
Coupler.io also allows you to blend Facebook Ads data with information from other sources. For example, our brand awareness dashboard uses data from Facebook Ads and GSC and lets you better understand your campaign impact.
Coupler.io provides a Facebook Ads integration to schedule data export to spreadsheets, BI tools, and data warehouses at a custom frequency, such as every hour, every day, etc. Use it to create custom Looker Studio Facebook Ads templates to facilitate your reporting.
Our guide to Facebook Ads reporting is not over yet. Although we’ve covered the most important things, some questions are still unanswered. So, we gathered them together in the FAQ section below.
Frequently asked questions about Facebook Ads reporting
What do I do when Facebook ads reports are not loading?
Export them with Coupler.io, of course. ? Actually, it’s not a joke. Facebook provides a dedicated section to troubleshooting data issues in Ads Reporting. And you should keep in mind that if your data doesn’t load in ads reporting, you may not be able to load it elsewhere either.
So, it’s better to ensure you have a backup running on a schedule. This is what Coupler.io can help you implement without any effort.
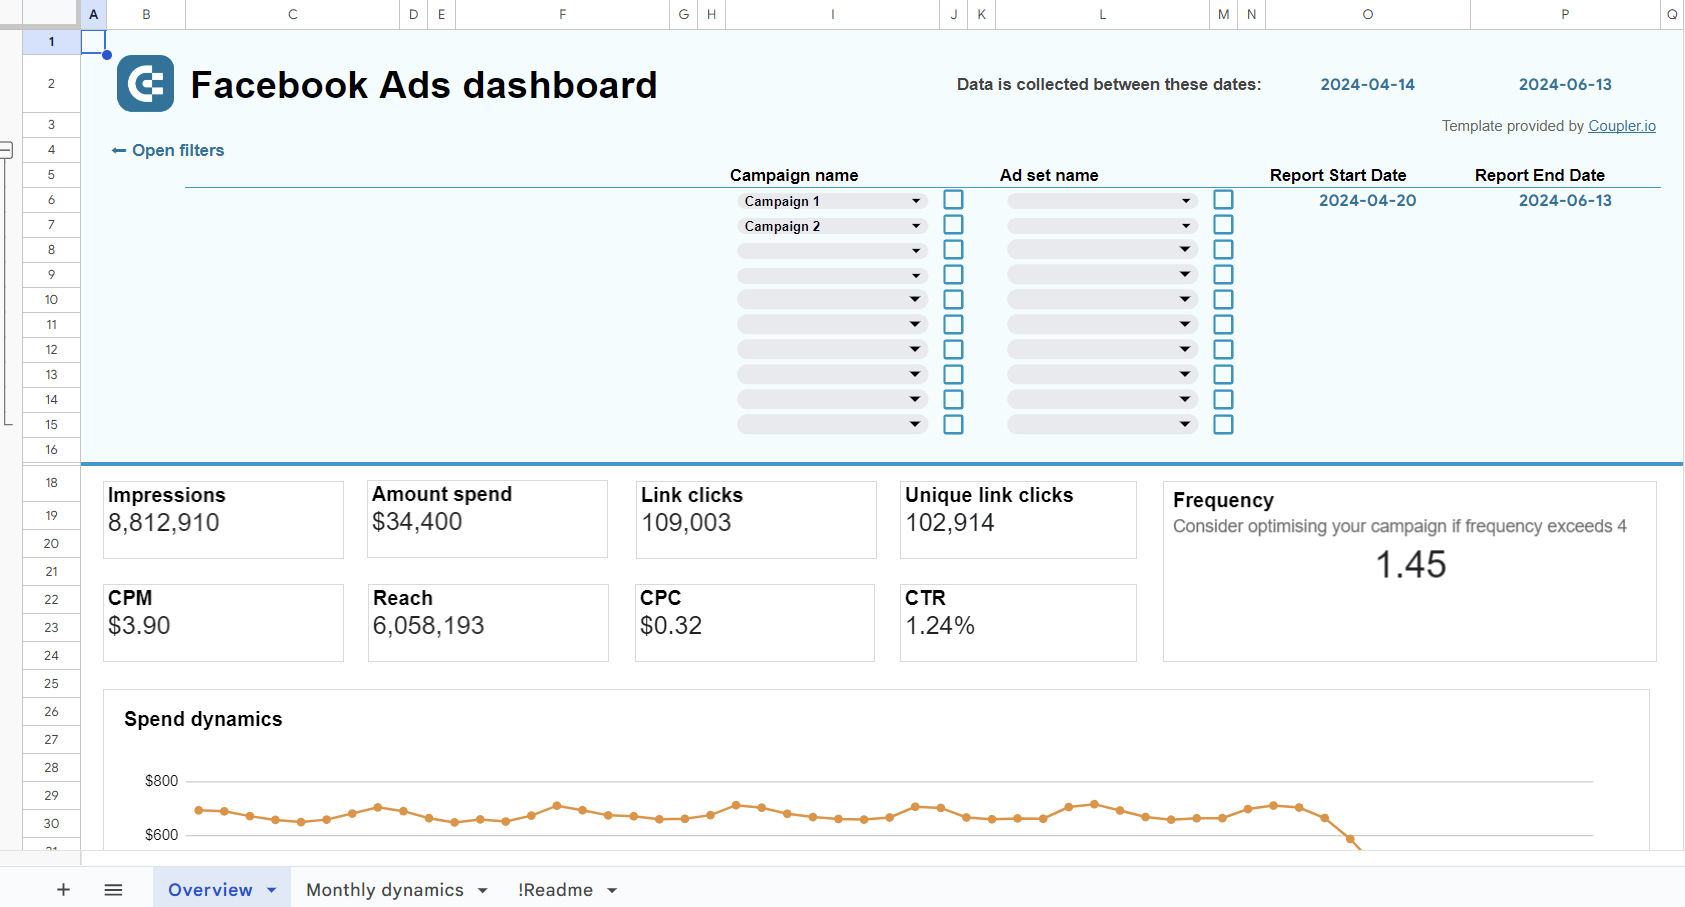
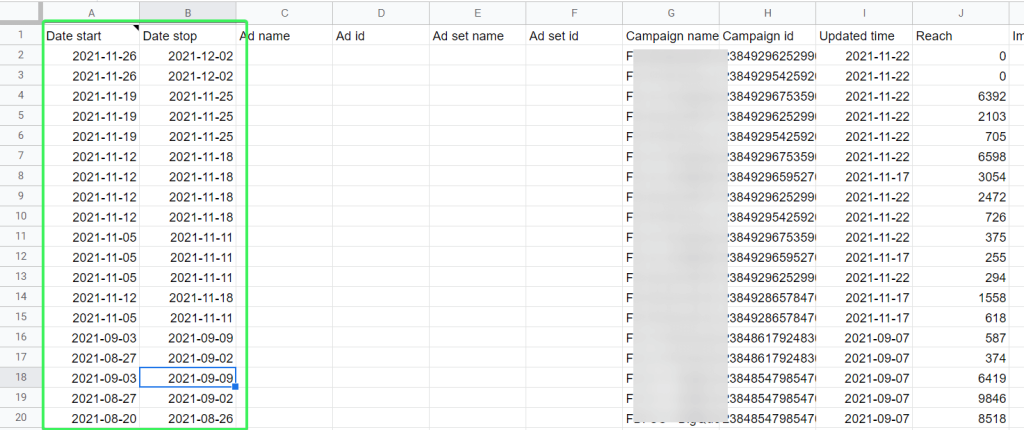
How to pull end date in Facebook Ads reporting
Information about the start and end date of your ads, ad sets, or campaigns will be available in any report that you’re exporting from Facebook Ads with Coupler.io. Here is how it looks:
Is there any difference between Facebook dynamic and sponsored ads reporting?
Although dynamic ads and sponsored ads on Facebook are used with different objectives, in terms of reporting, they are just Facebook ads. This means that there will be no explicit differentiation between those types of ads in your report data.
Native vs. custom Facebook Ads Reporting
As a wrap-up, let’s try to answer the eternal question of choice. However, in the case of reports in Facebook Ads, it looks clear as day. If you need more than Facebook Ads Reporting can provide, then export your data and manipulate it in whatever way you need. A special bonus is that scheduled exports will let you have a backup of your data outside Facebook.
If you believe that the native reporting functionality is more than enough for your needs then….do nothing. But, I bet you’ll get back to this once your business grows bigger and bigger. So, sooner or later, you’ll need a more advanced solution to understand how to optimize Facebook Ads and cover your reporting needs. Good luck with your data!

Automate Facebook Ads reporting with Coupler.io
Get started for free